
Free  ·  No ads  ·  No signup

A Better Lens on
Global Financial Markets

Look at markets the way you never have before.

Disentangle risk, performance and cycles across 100 years of market history.
Complex finance expressed in simple but powerful charts.
From heatmaps to derivative strategies — one tool, every horizon.
Smarter tools provide better insights.
Disentangle long-term performance from short-term noise.
Download Desktop App
80+
Global markets
100+
Years of history
10,000+
Global corporates
30+
Countries

Built for anyone who wants a sharper, deeper lens on global financial markets.

Monthly Insights  ·  Index Academy  ·  Derivative Academy  ·  User Manual

Finance Academics Investment Analysts Financial Journalists Strategy Consultants Portfolio Managers Informed Investors
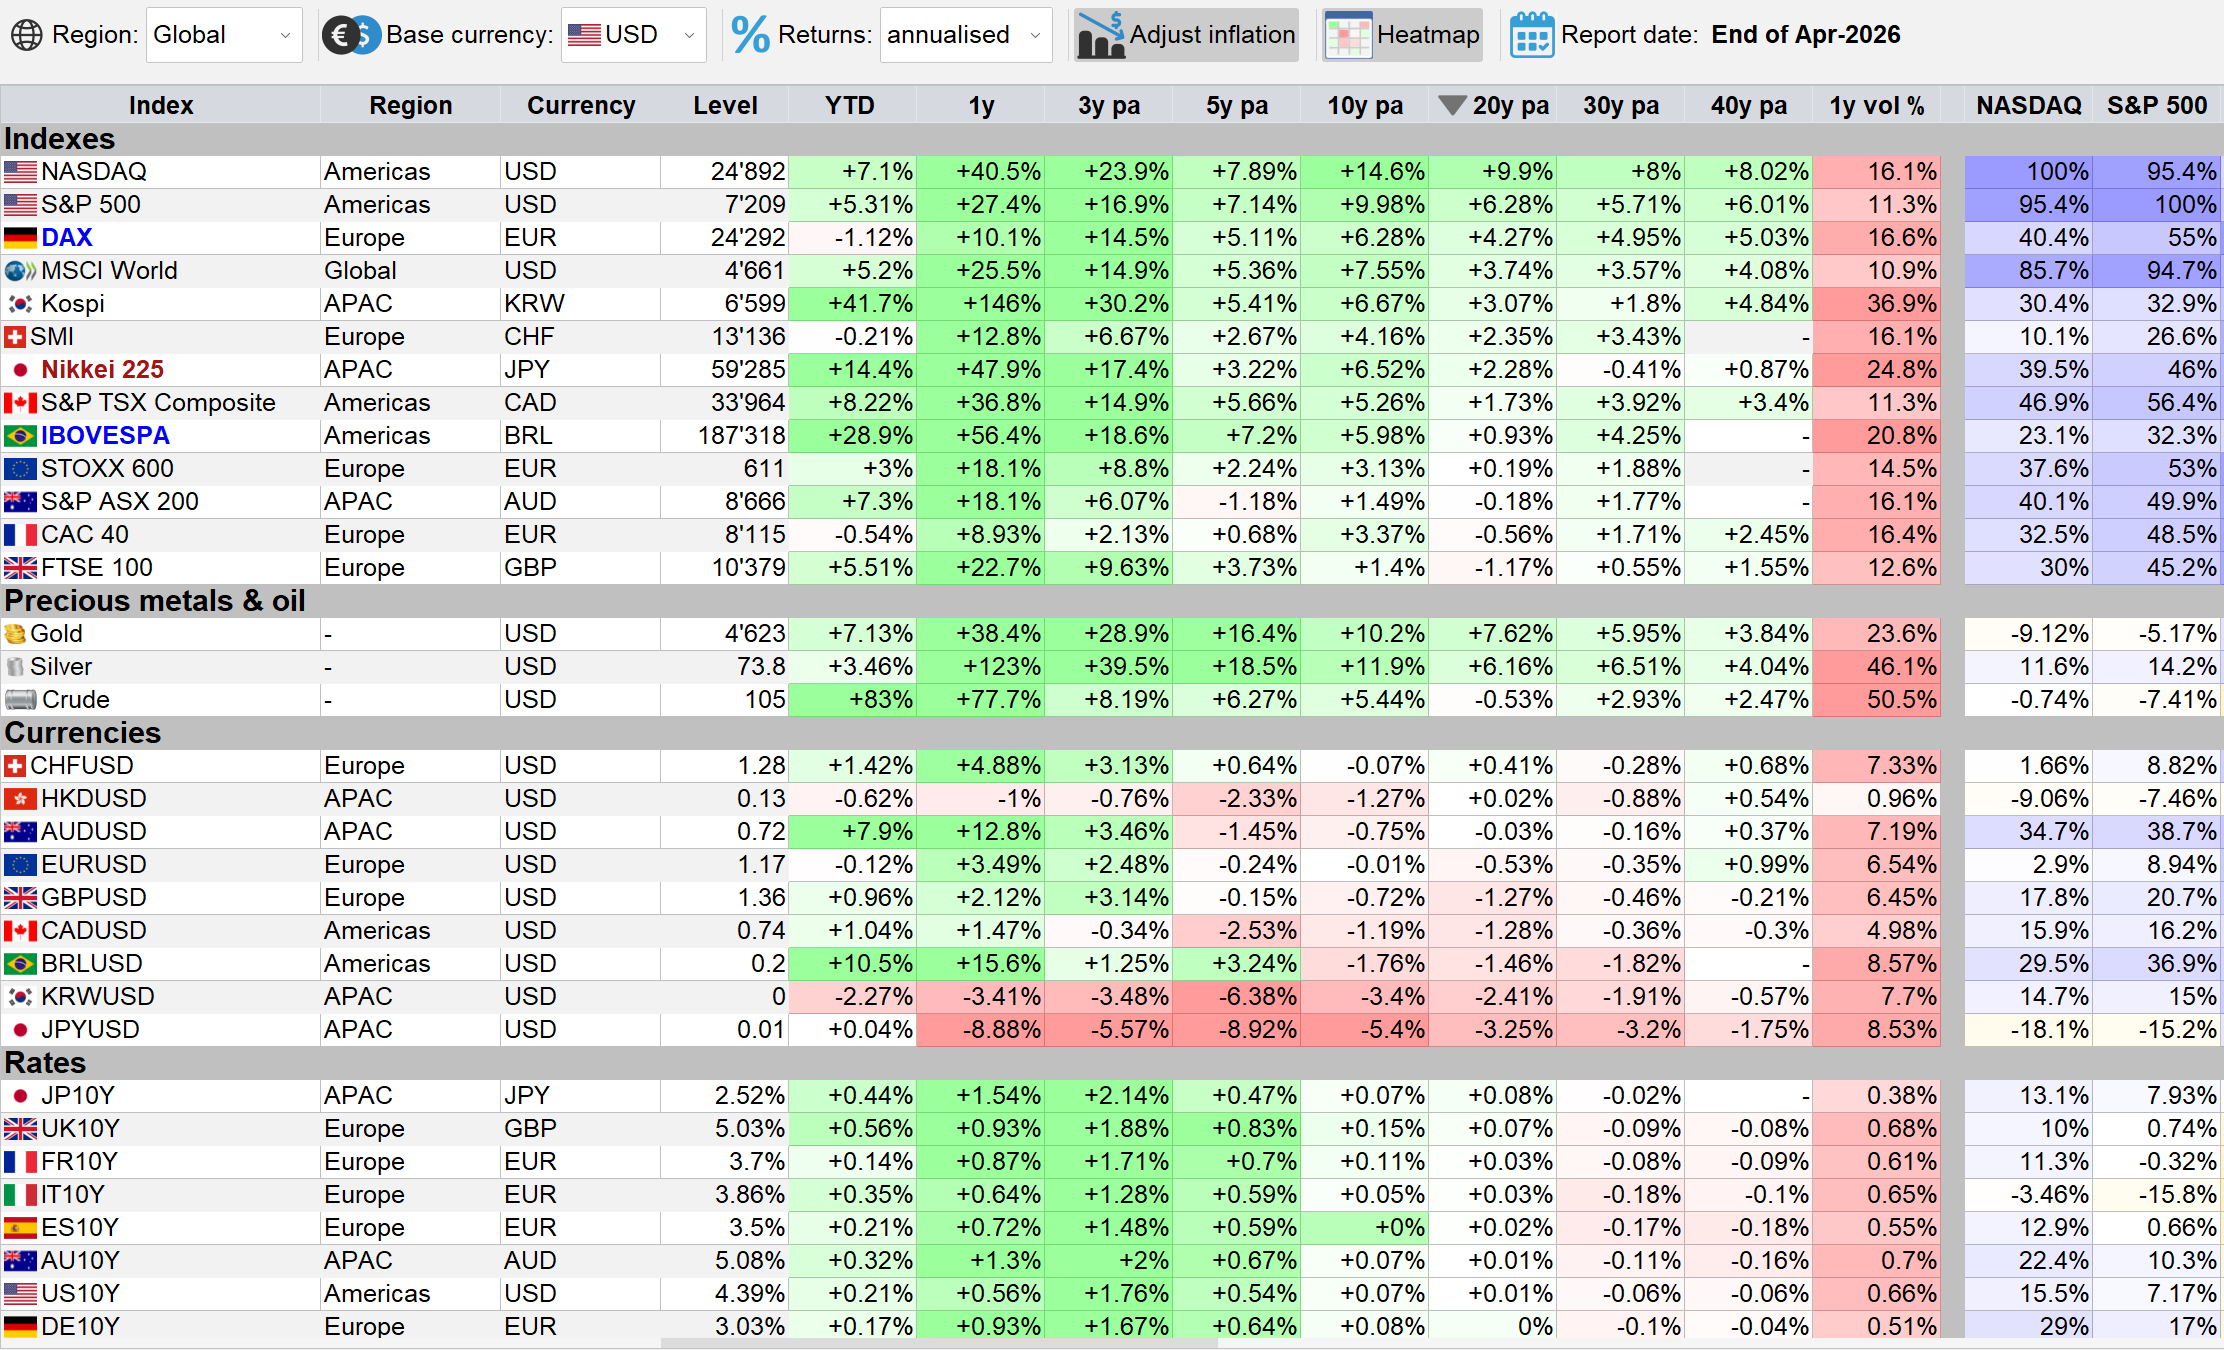
Global markets heatmap
Global Markets Heatmap — risk, return & correlations at a glance
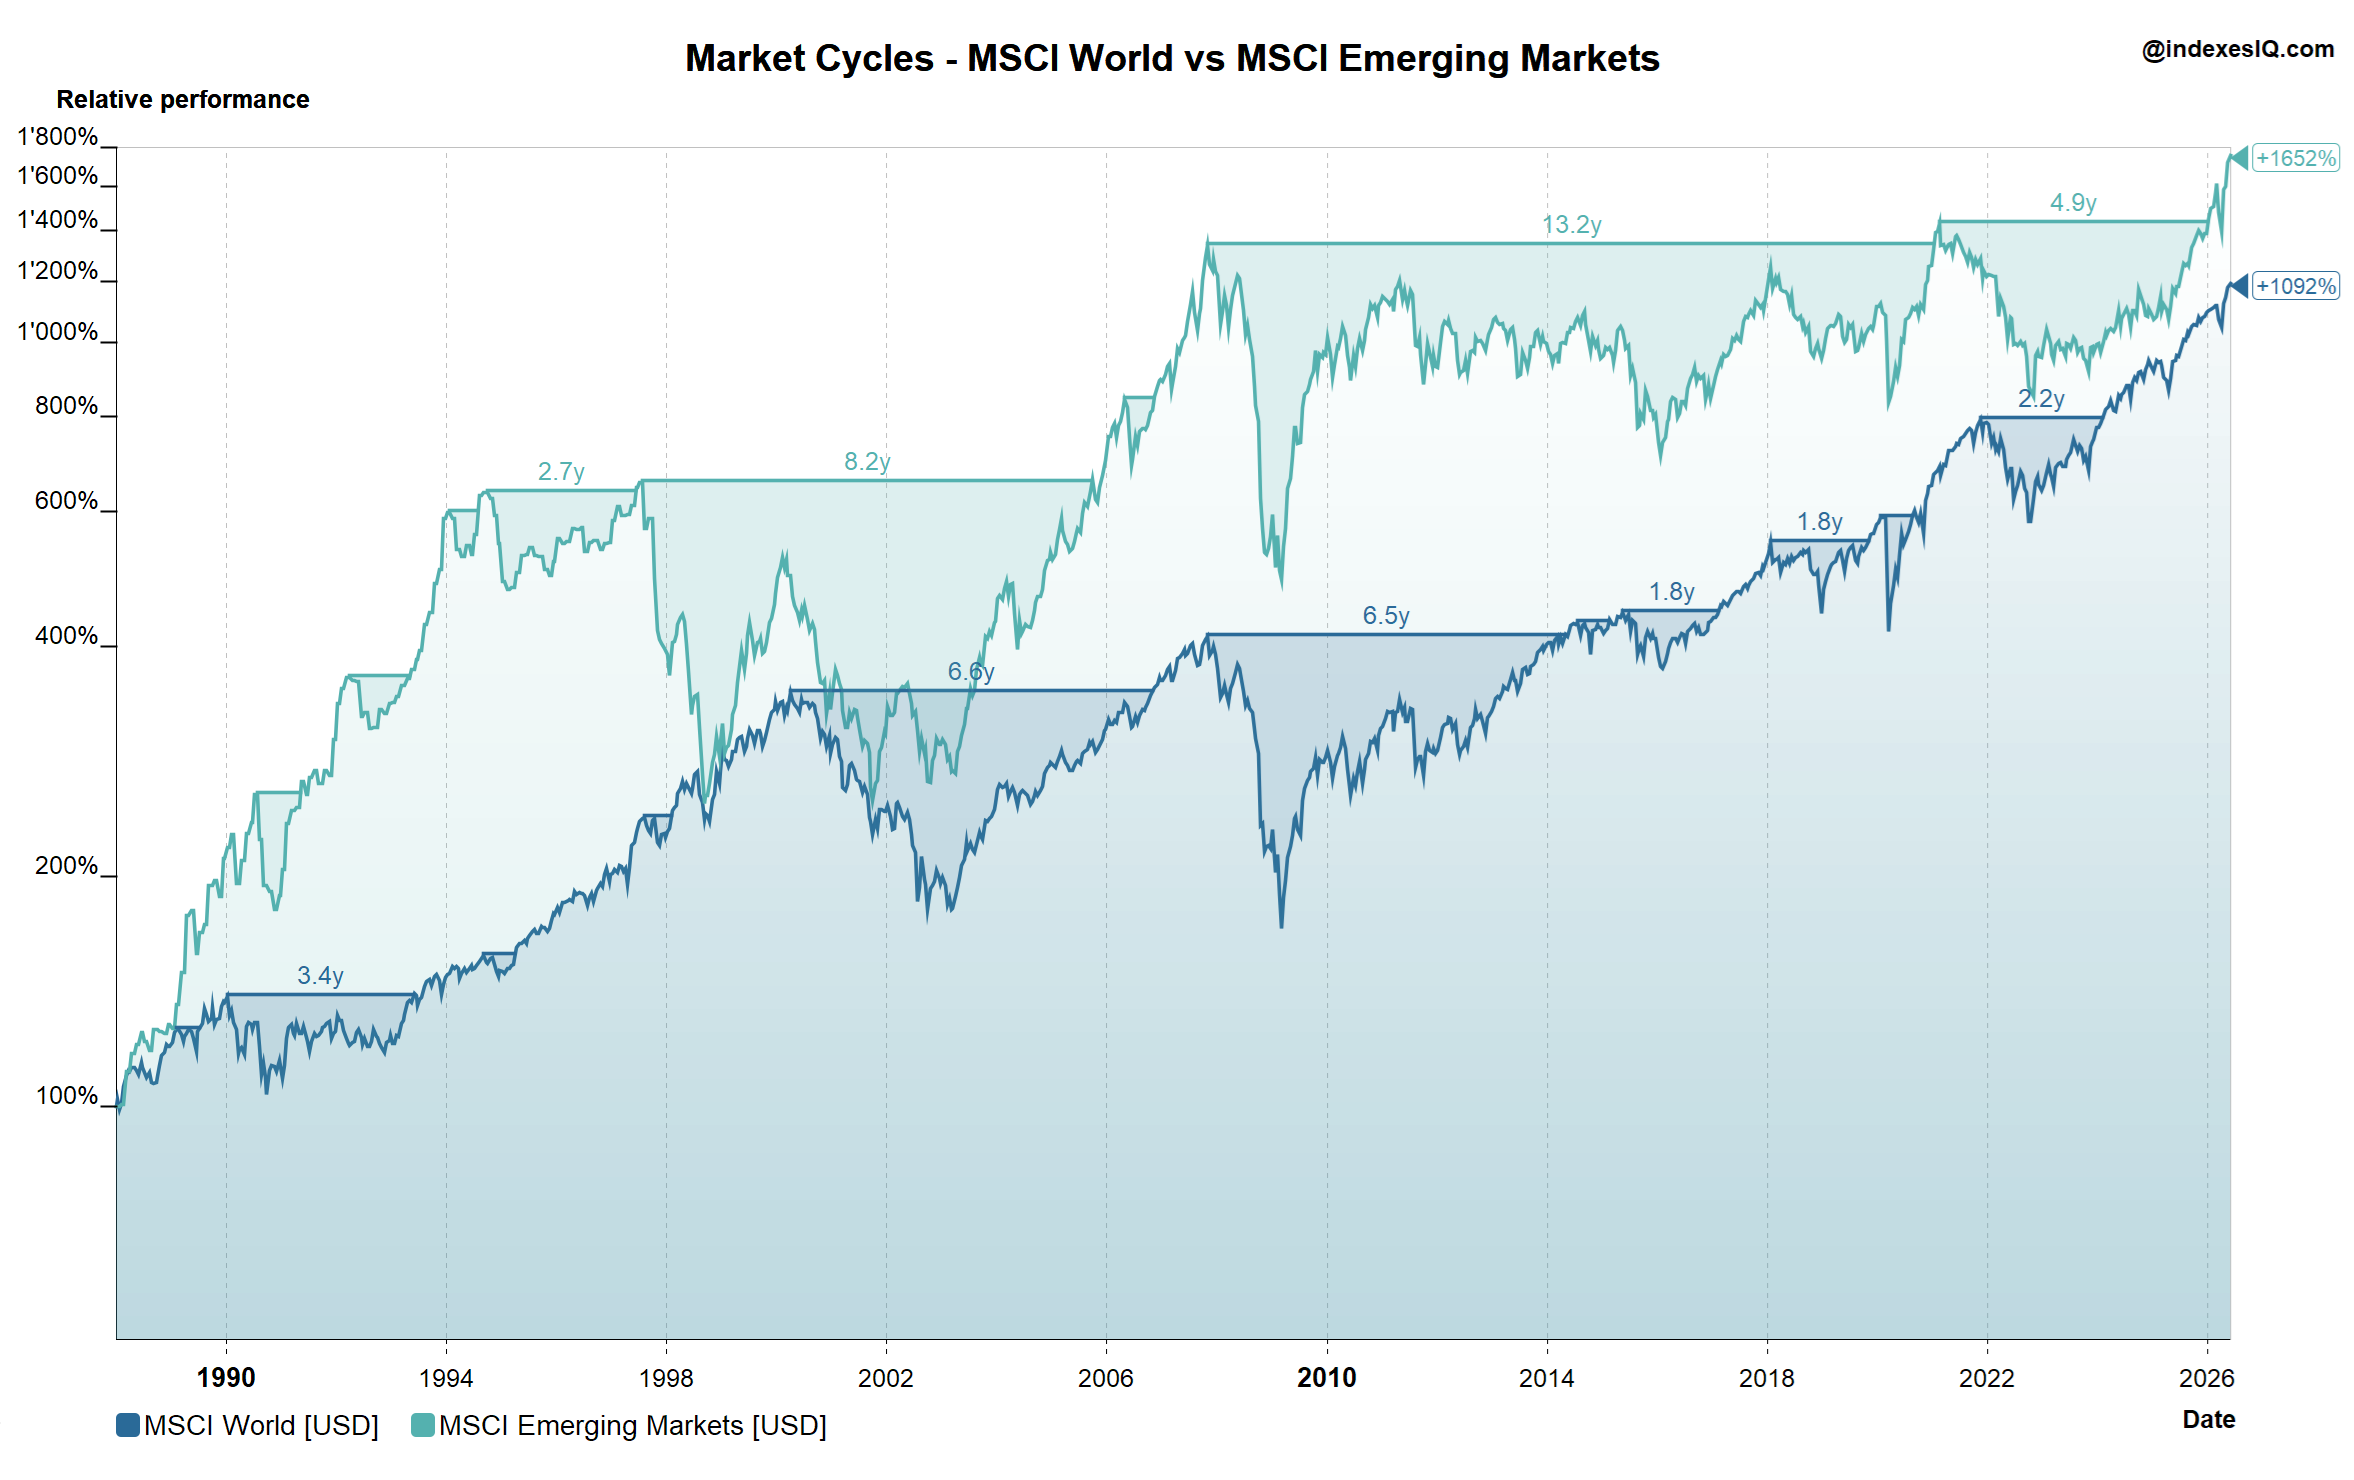
MSCI World vs EM market cycles
MSCI World vs EM — diversification of cycles
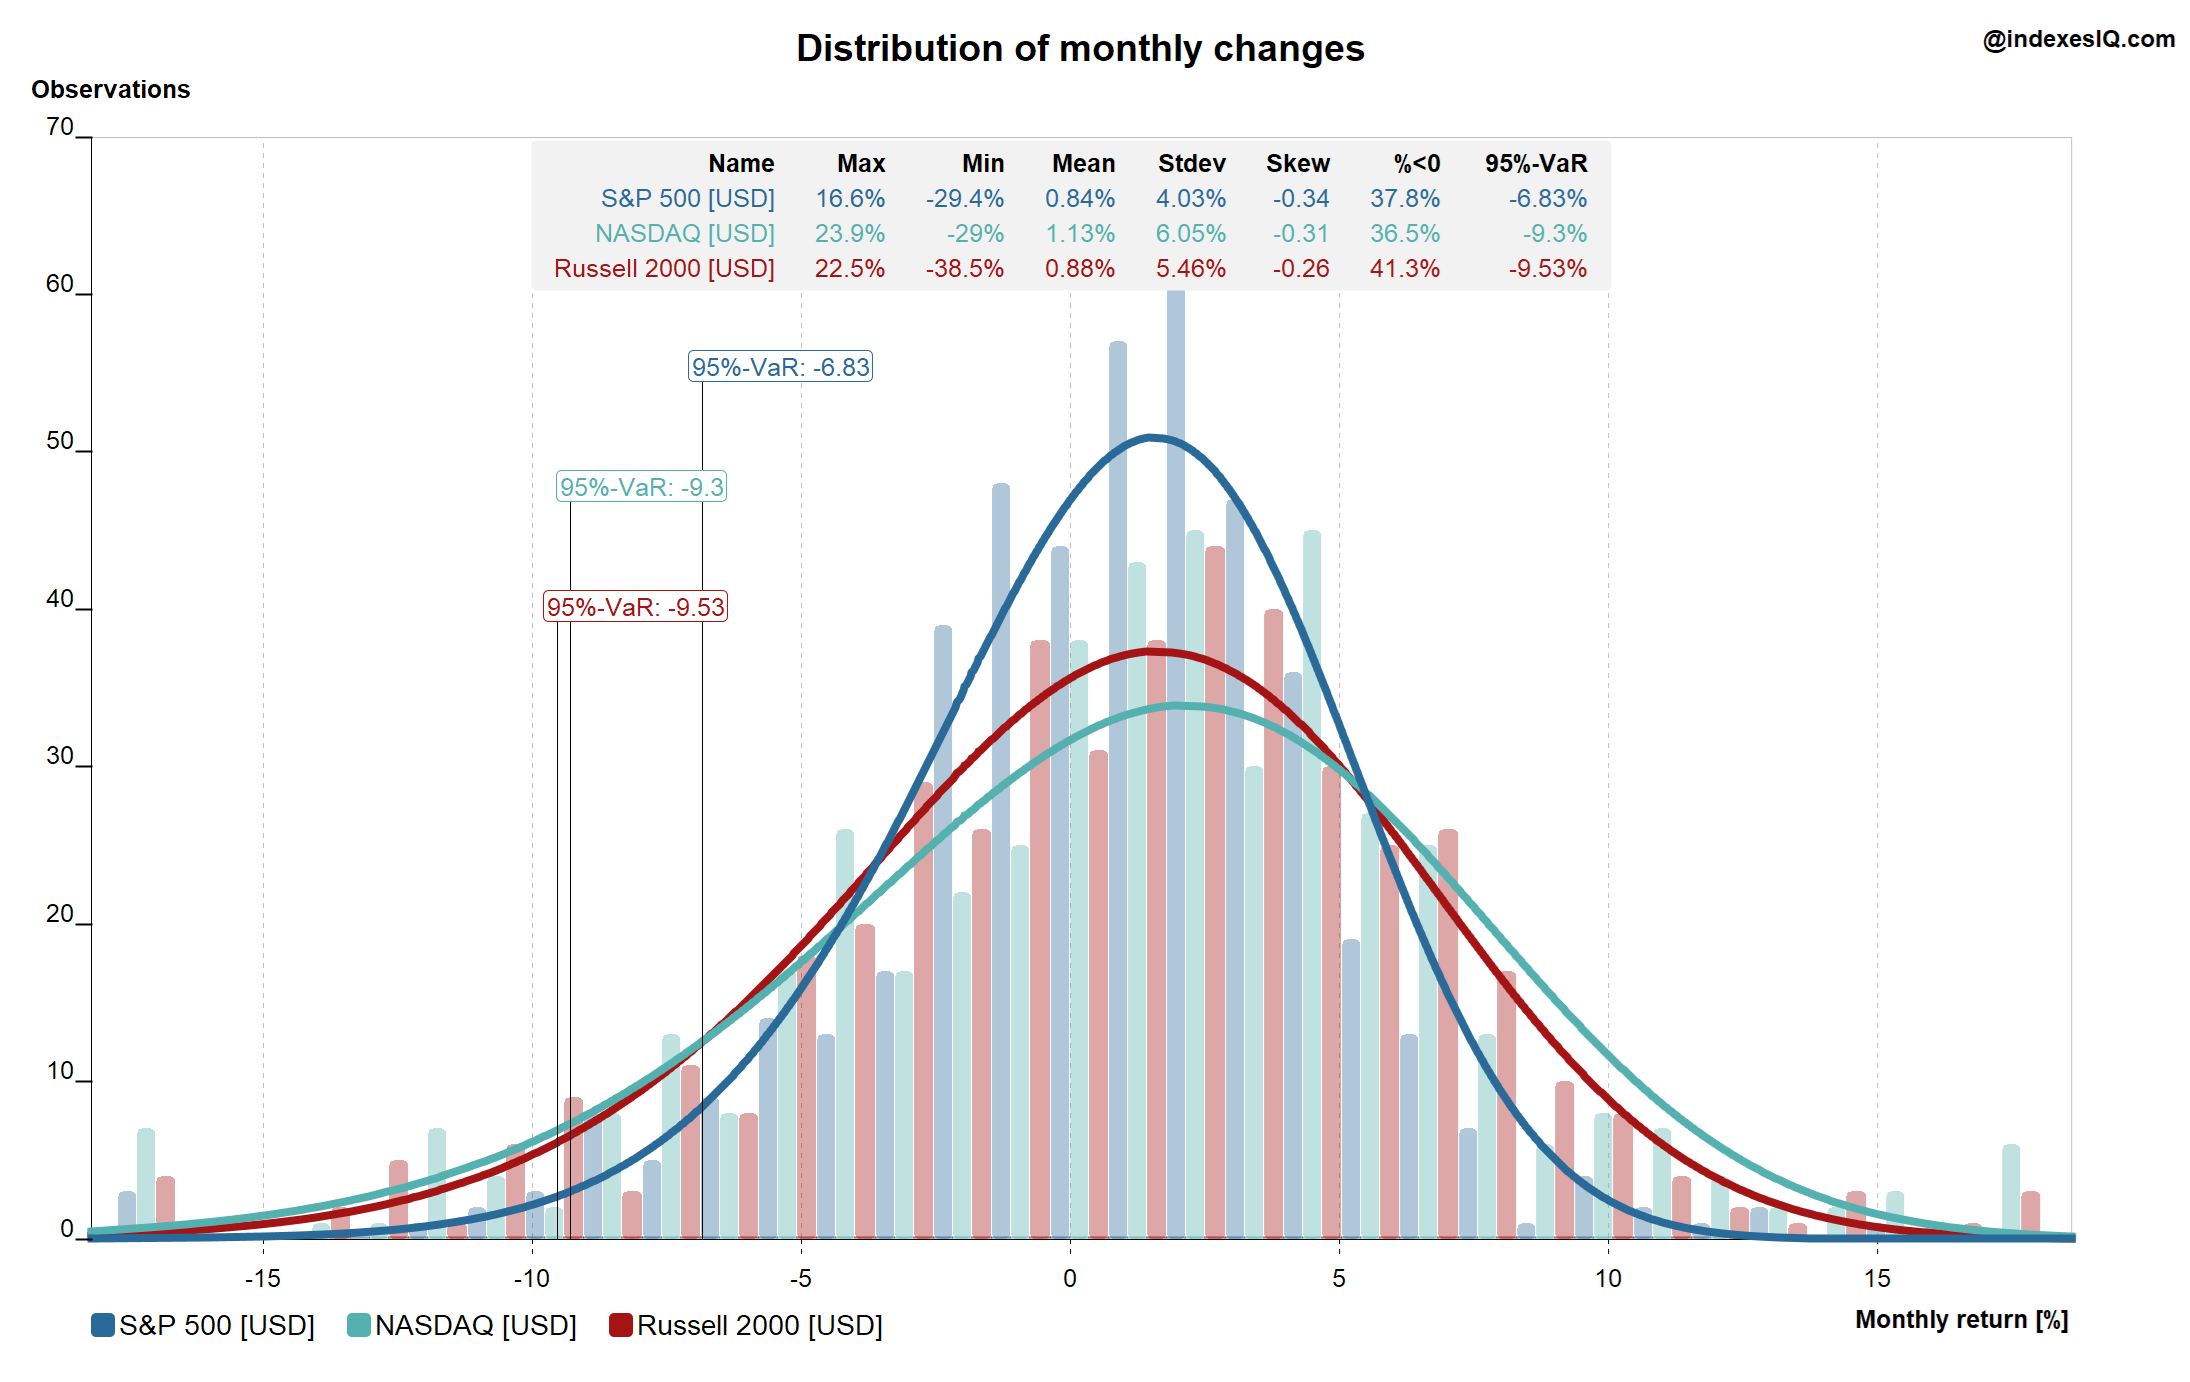
Return distribution and Value at Risk
Return distributions & Value-at-Risk
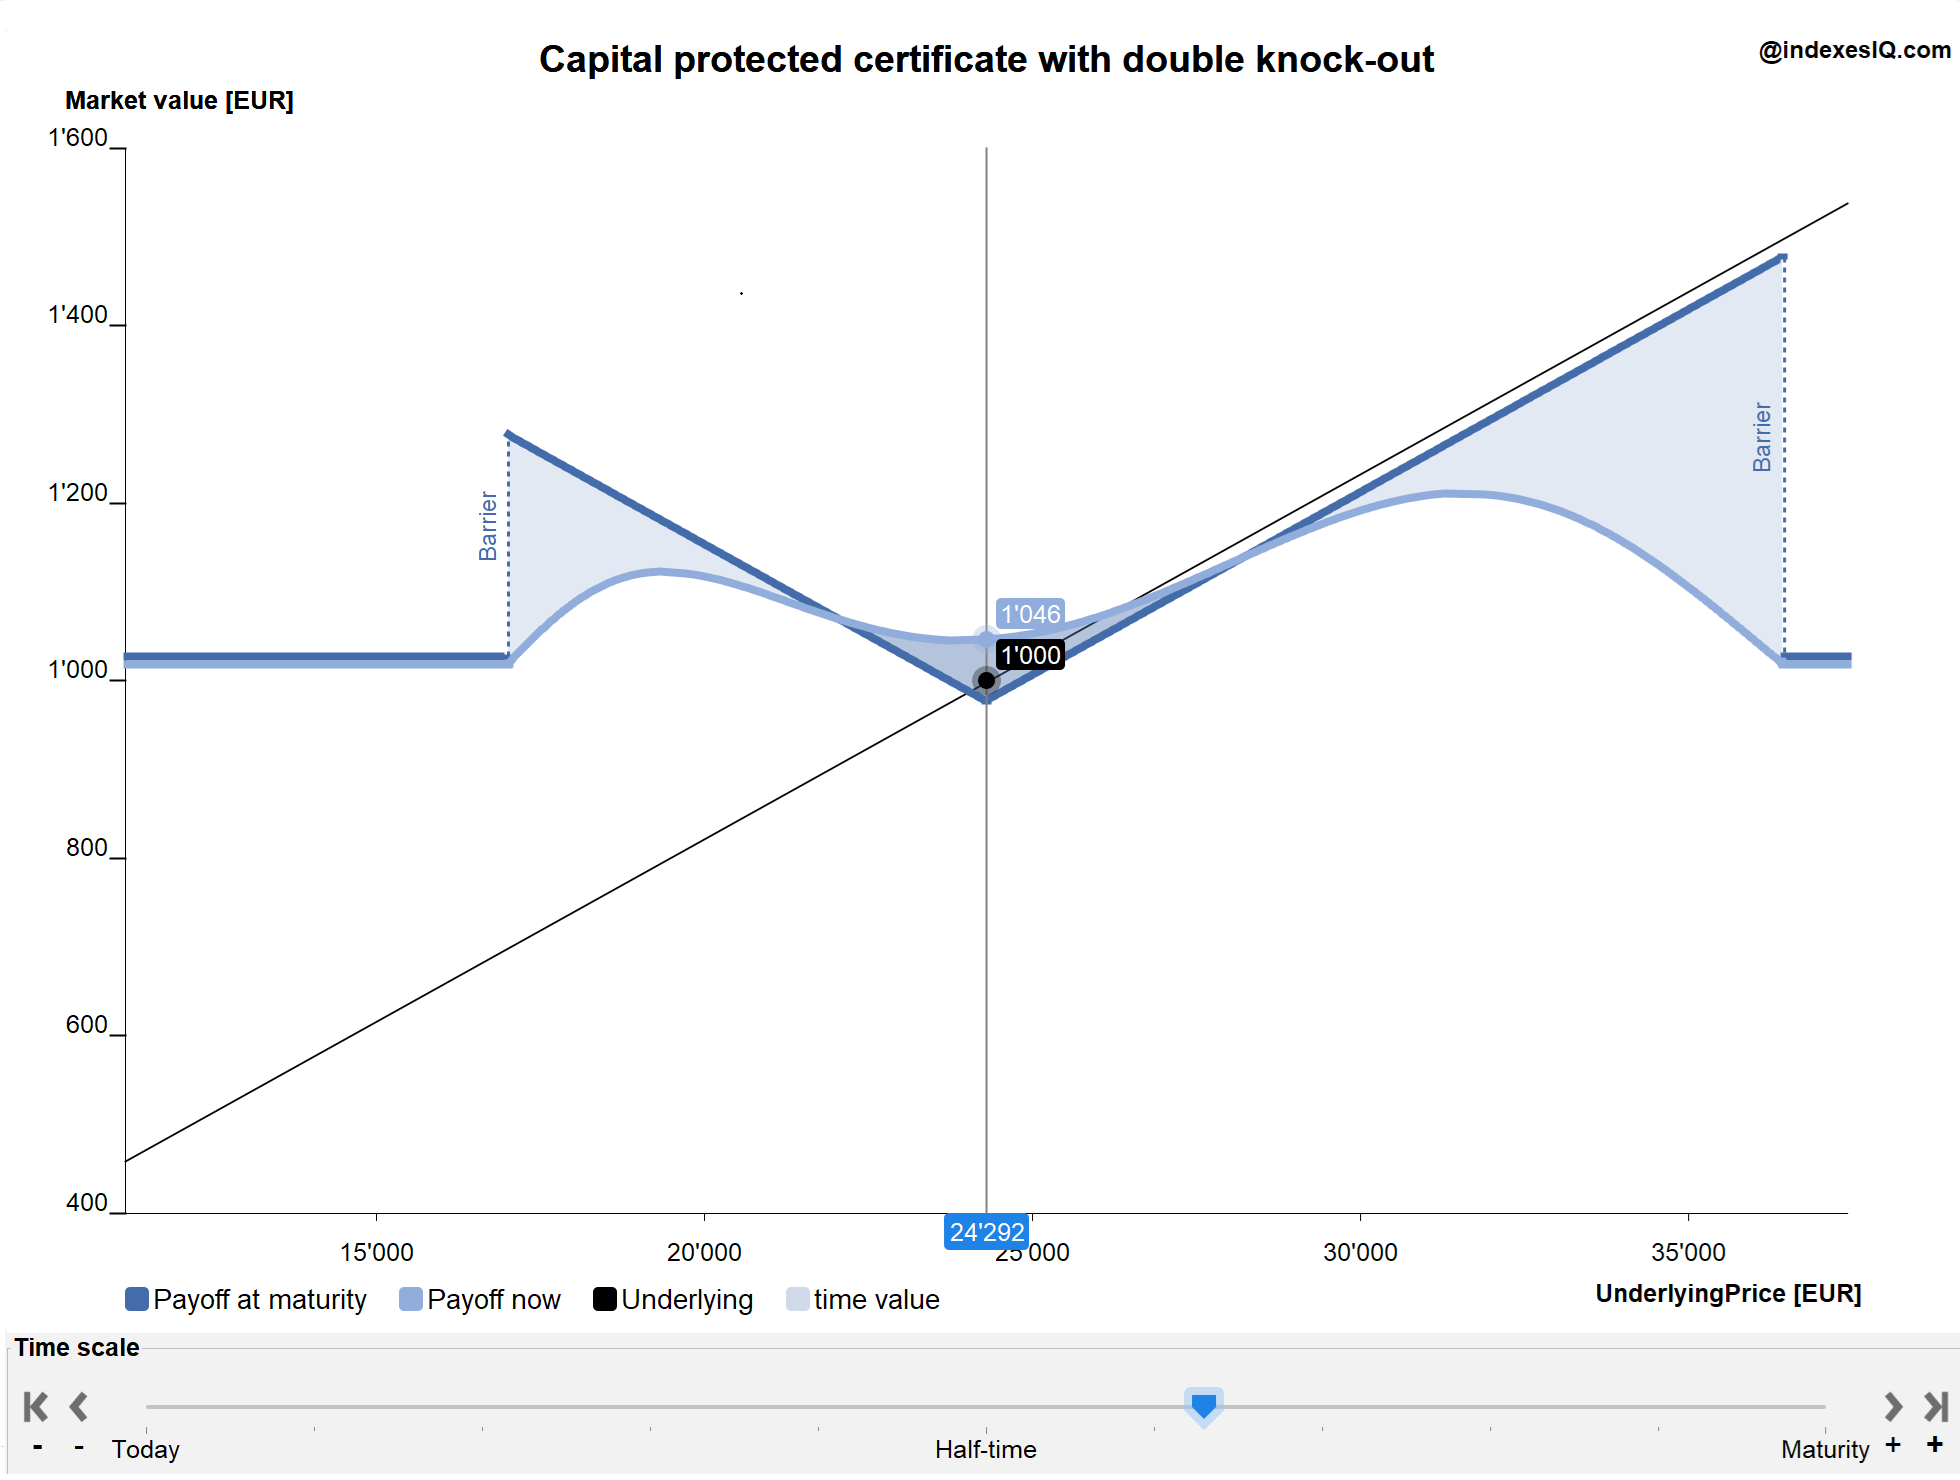
Derivative strategy pay-offs
Equity and treasury interaction
Equity & treasury — long-term interaction
Quick Tour — use cases 1 / 15
Heatmap
Use Case 1
Map the global financial ecosystem at a glance
  • Compare flagship equity indexes, FX, commodities, treasuries and central bank rates in one view
  • Sort and rank markets by performance over different time horizons
  • Currency-align returns and adjust for inflation
  • Analyse correlations between different markets
Download App
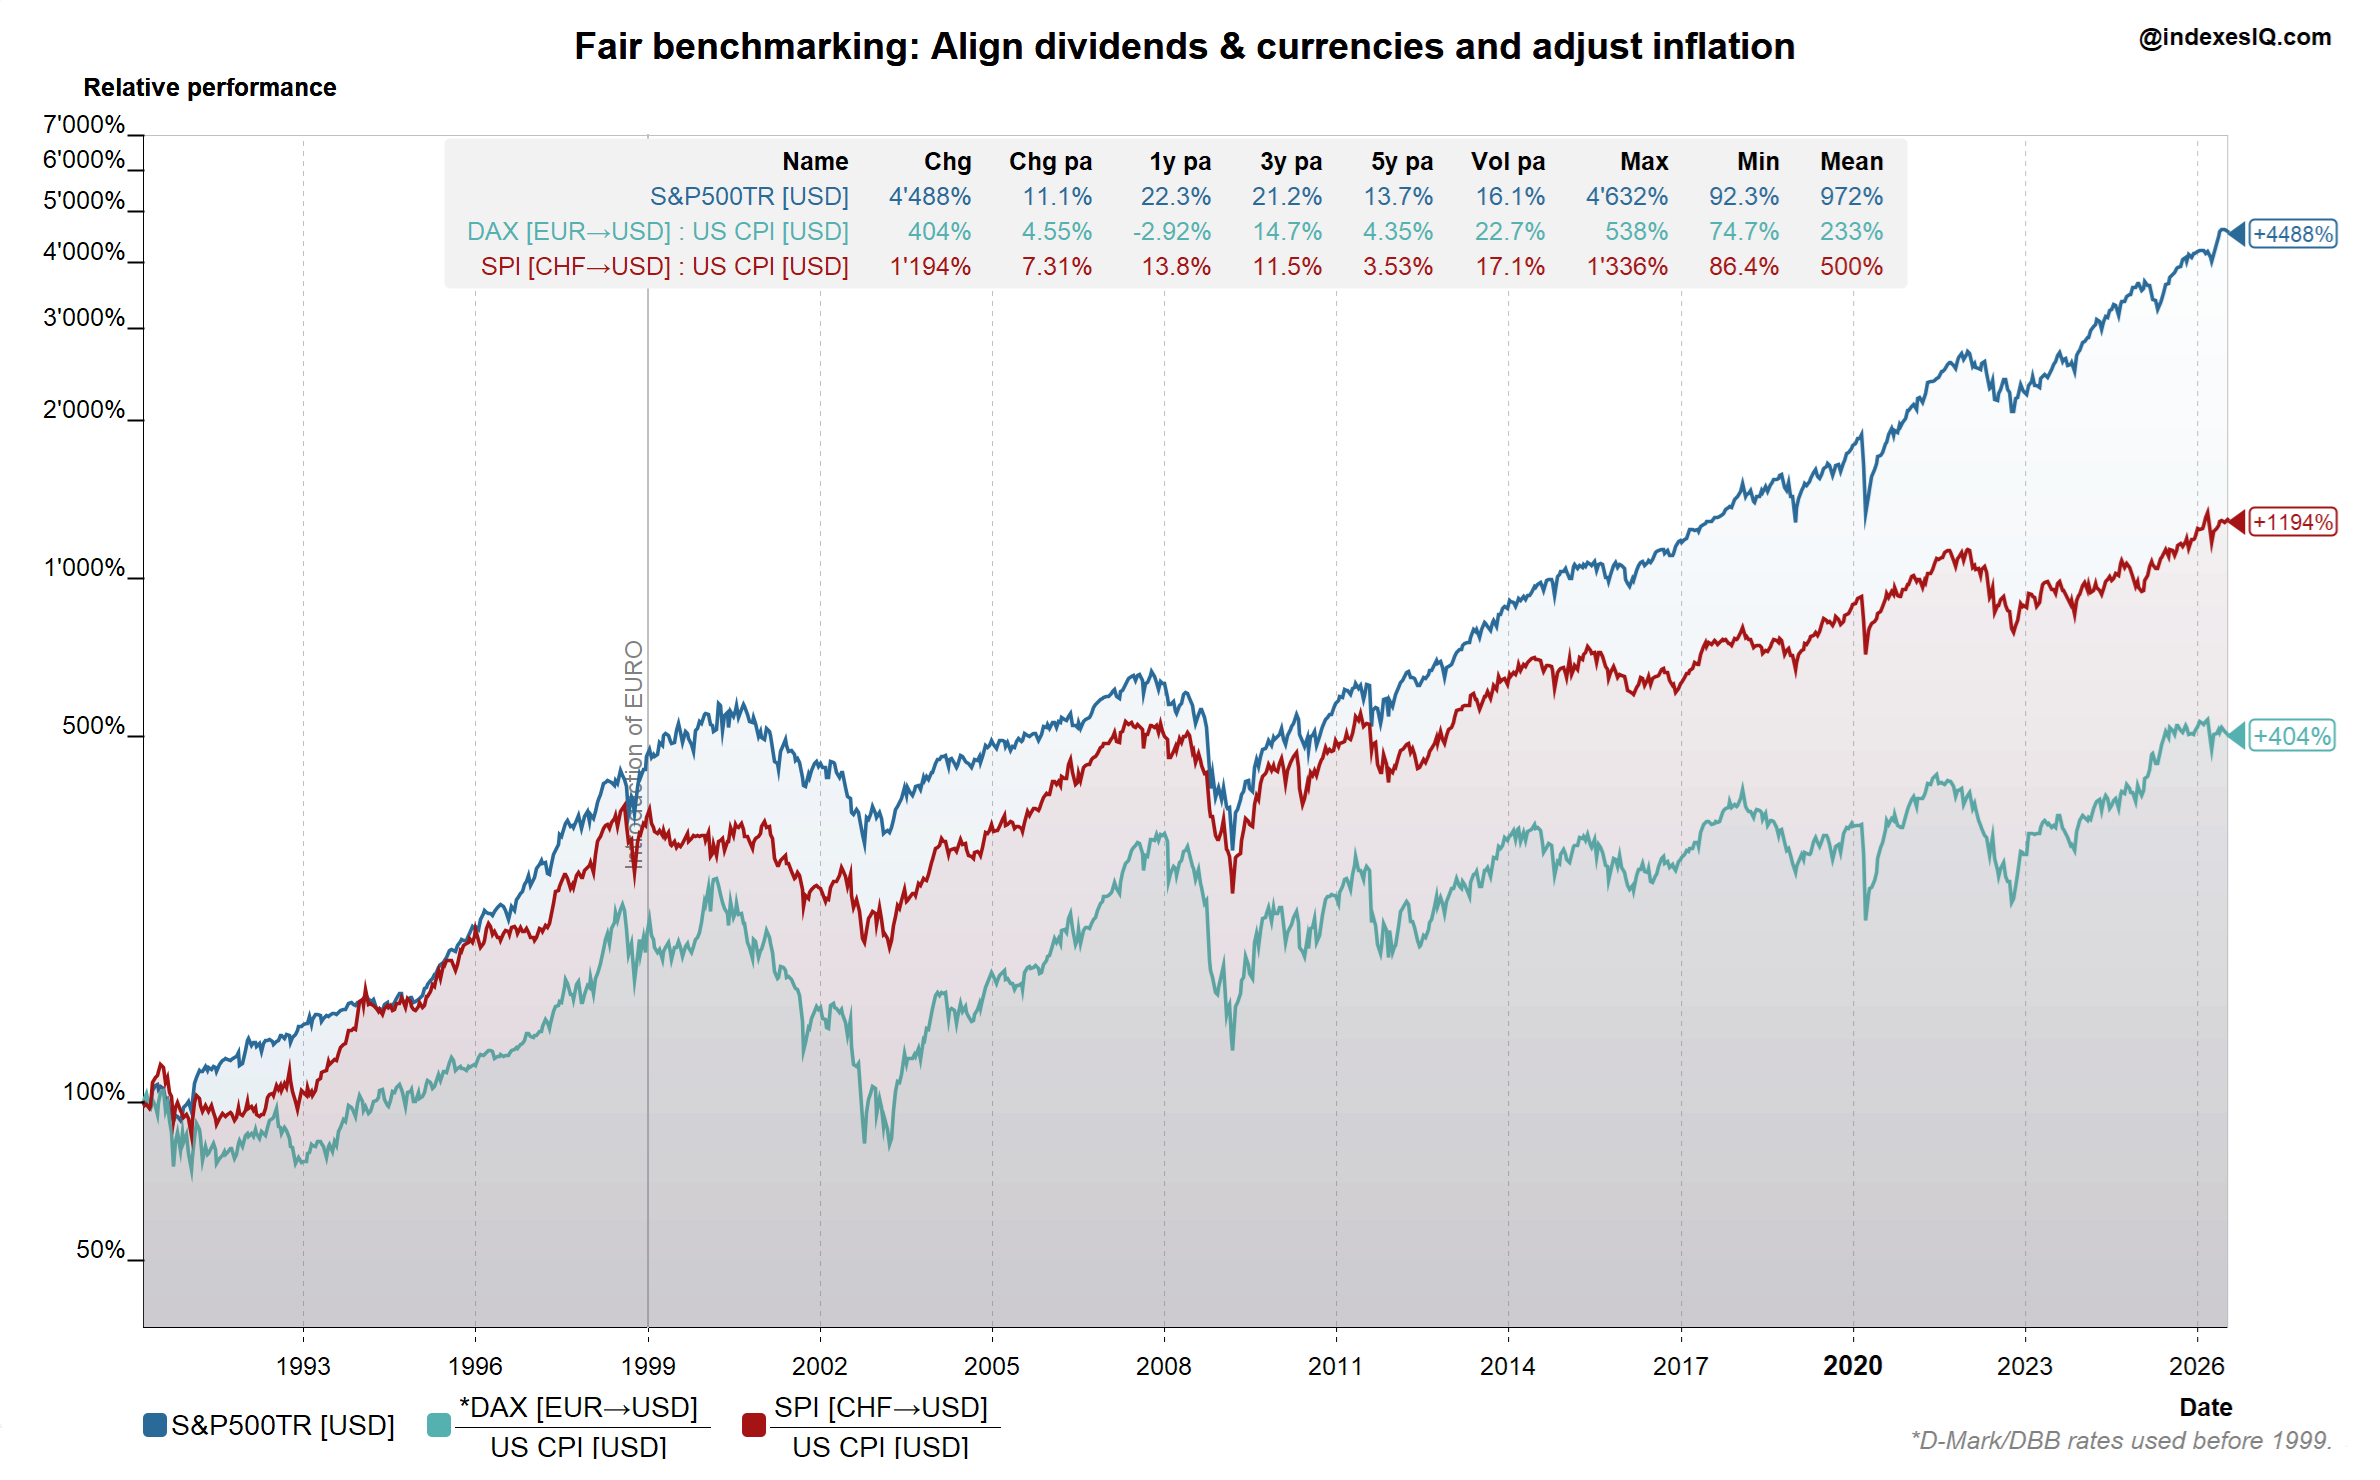
Fair benchmarking
Use Case 2
Fair Benchmarking — Align Dividends, Currencies and Inflation
  • Compare long-term performance across markets on a genuinely level playing field
  • Convert all returns to a common currency and adjust for inflation
  • Use total return indexes consistently — S&P 500 TR vs DAX and SPI — to avoid dividend methodology distortions
  • See how much apparent outperformance disappears once you align the methodology
Download App
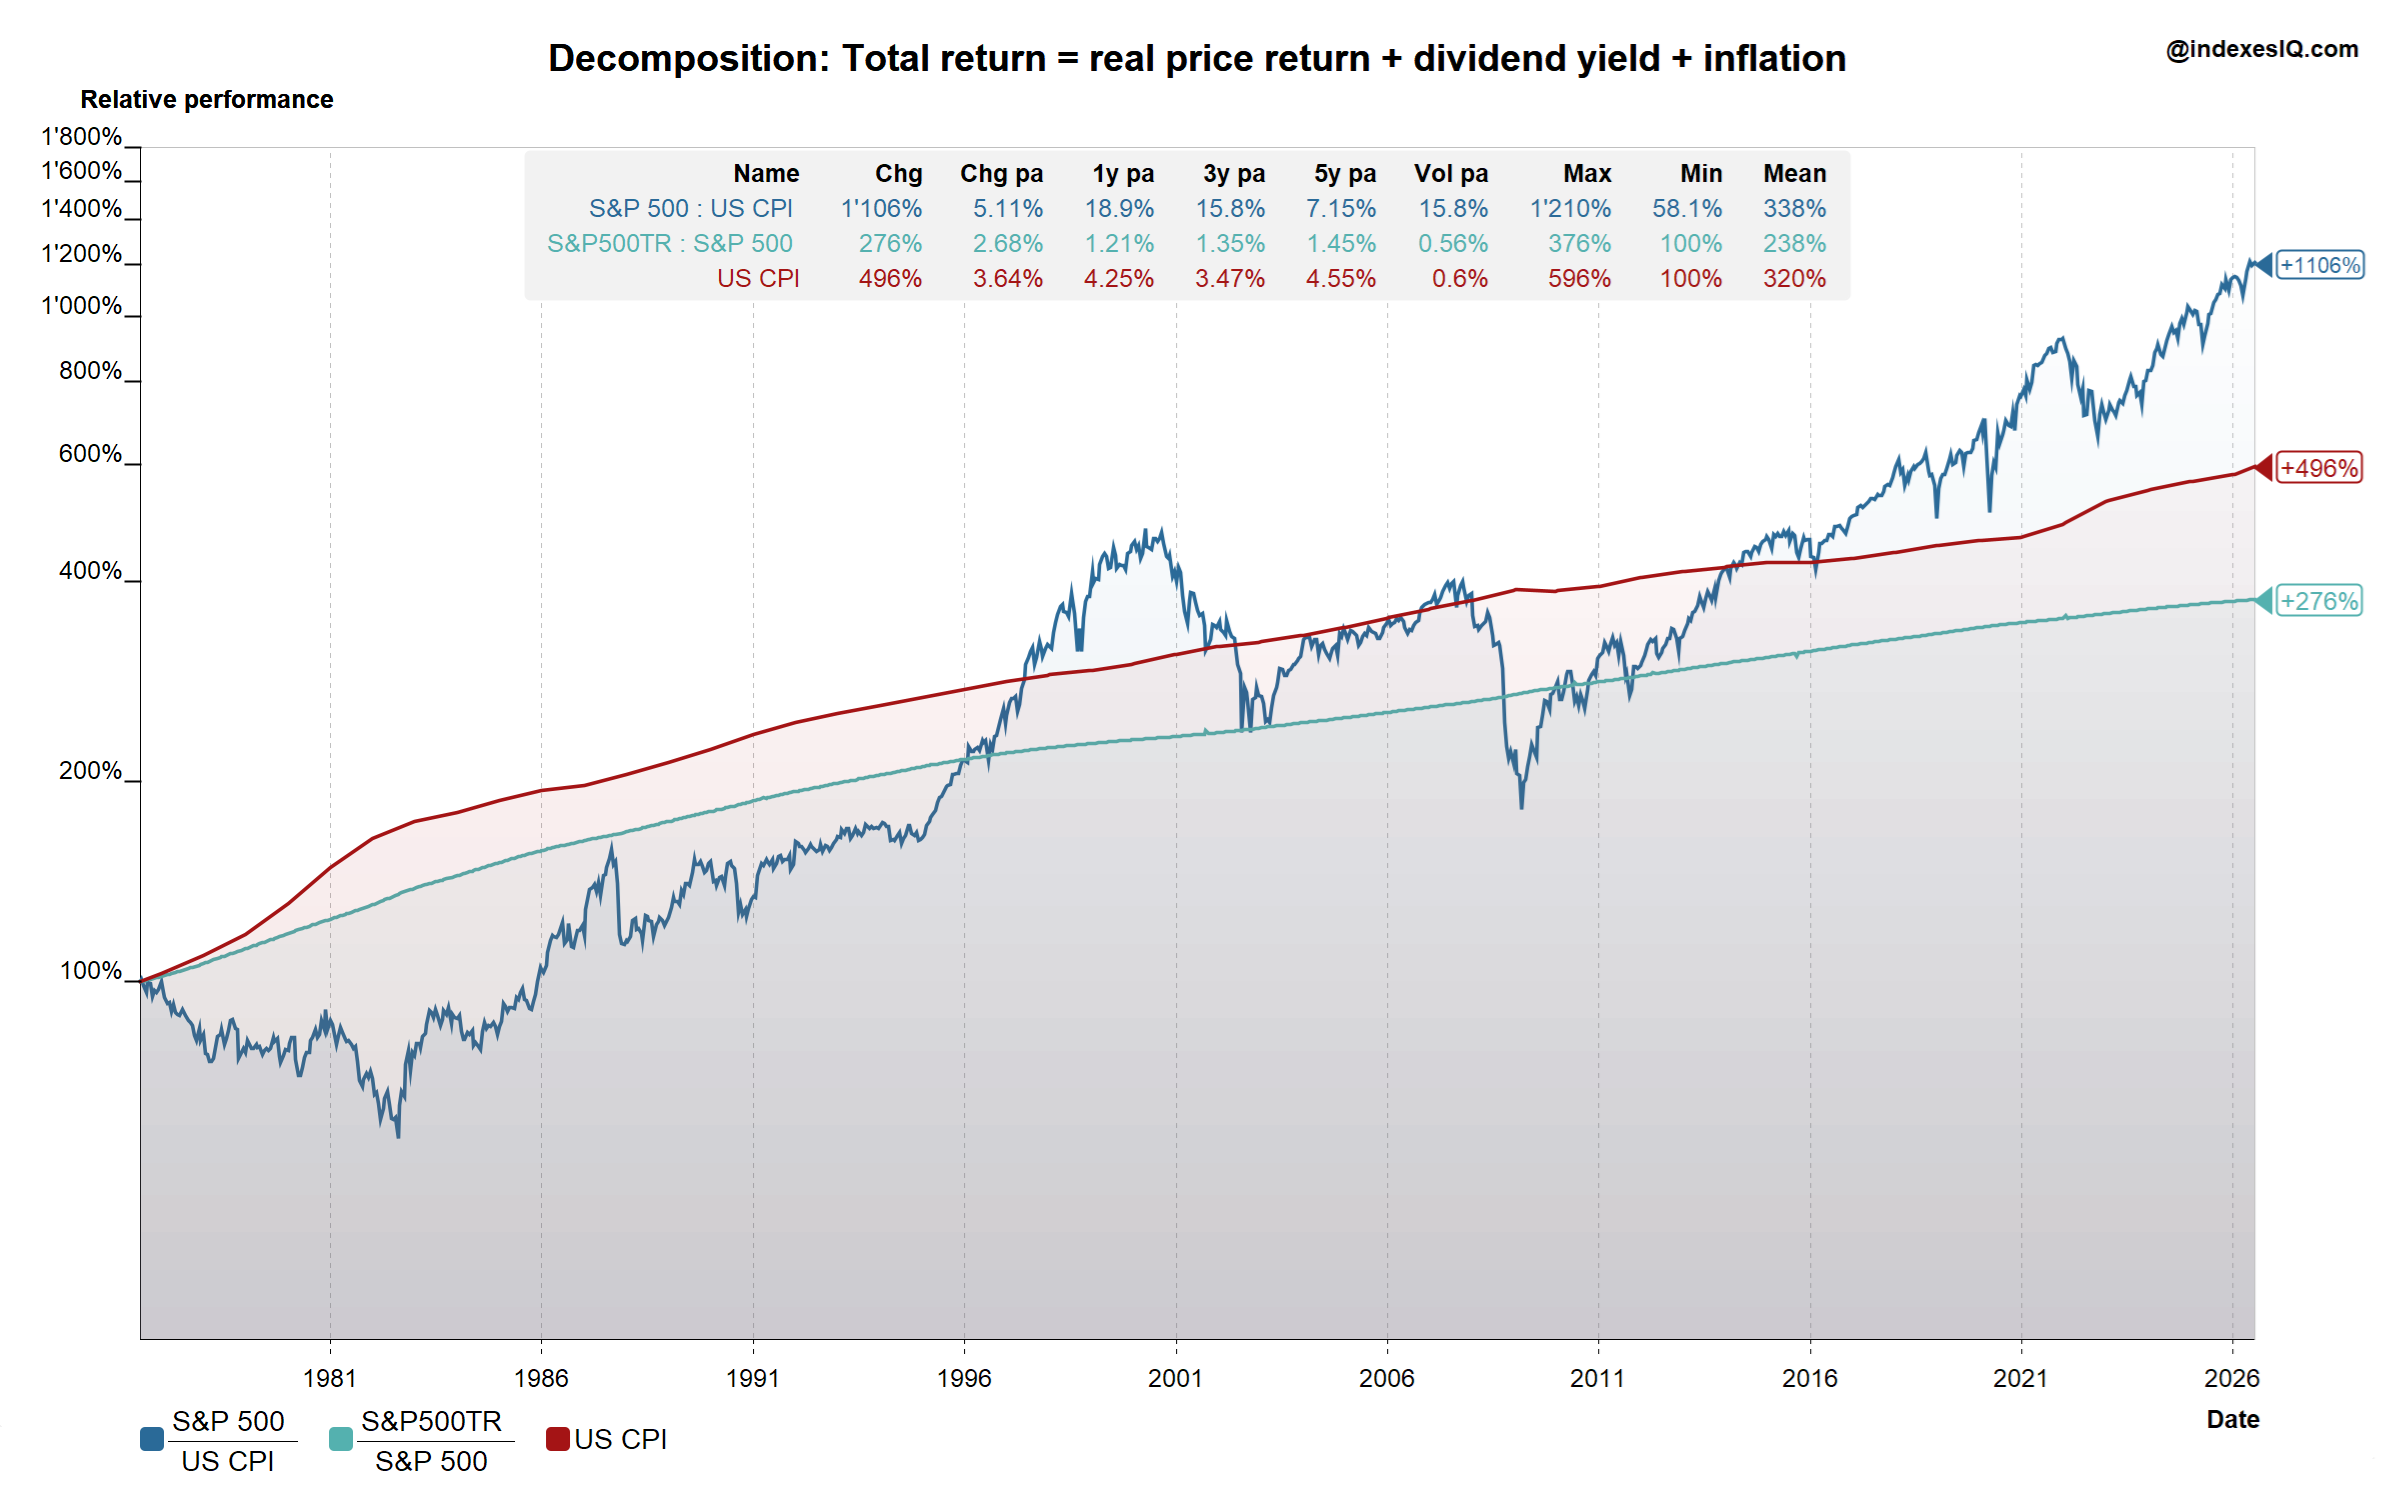
Decompose total returns
Use Case 3
Decompose Total Returns into Price, Dividends and Inflation
  • Break any total return index into its three components: real price return, dividend yield and inflation
  • Understand where returns are really coming from — catching up with inflation, dividends, or genuine real price growth
  • Applies to the S&P 500 TR and other total return indexes
Download App
MSCI cycles
Use Case 4
Compare market cycles across developed and emerging markets
  • Both MSCI World and EM move in steps — phases of strong performance followed by flat phases
  • The two segments show different cyclical behaviour, offering genuine cycle diversification
  • Visualise how the cycles interact and diverge over decades
Download App
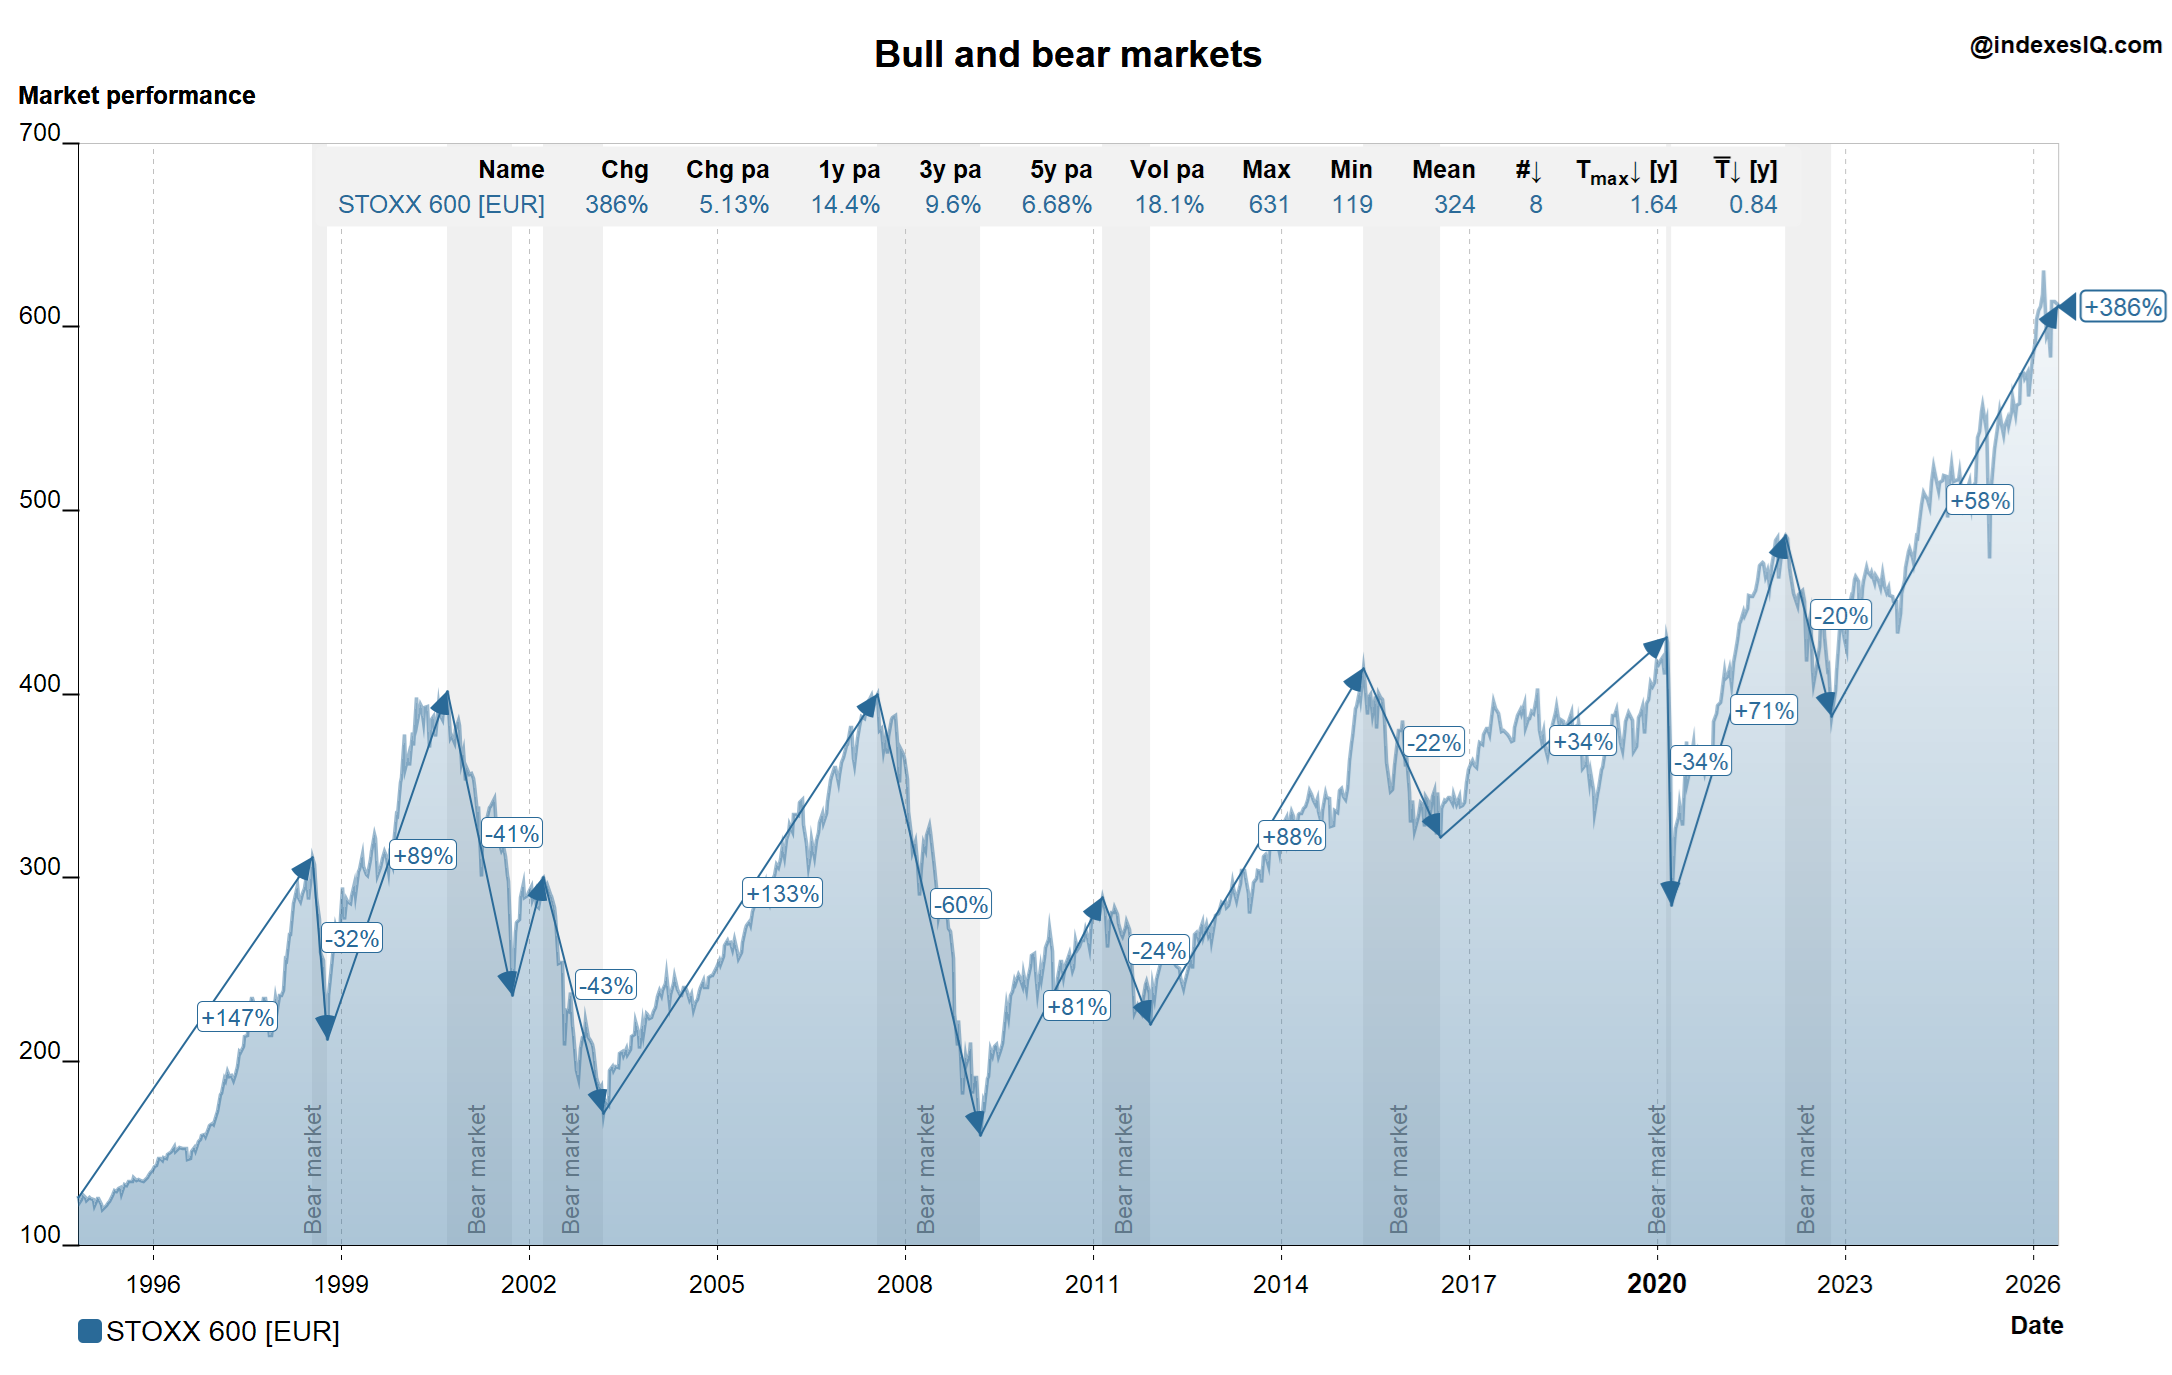
Bull and bear cycles
Use Case 5
Identify long-term bull and bear market cycles
  • Analyse long-term bull and bear markets across any index
  • Understand how long market cycles may take and their return implications
  • Compare cycle lengths and magnitudes across different markets
Download App
Performance per decade
Use Case 6
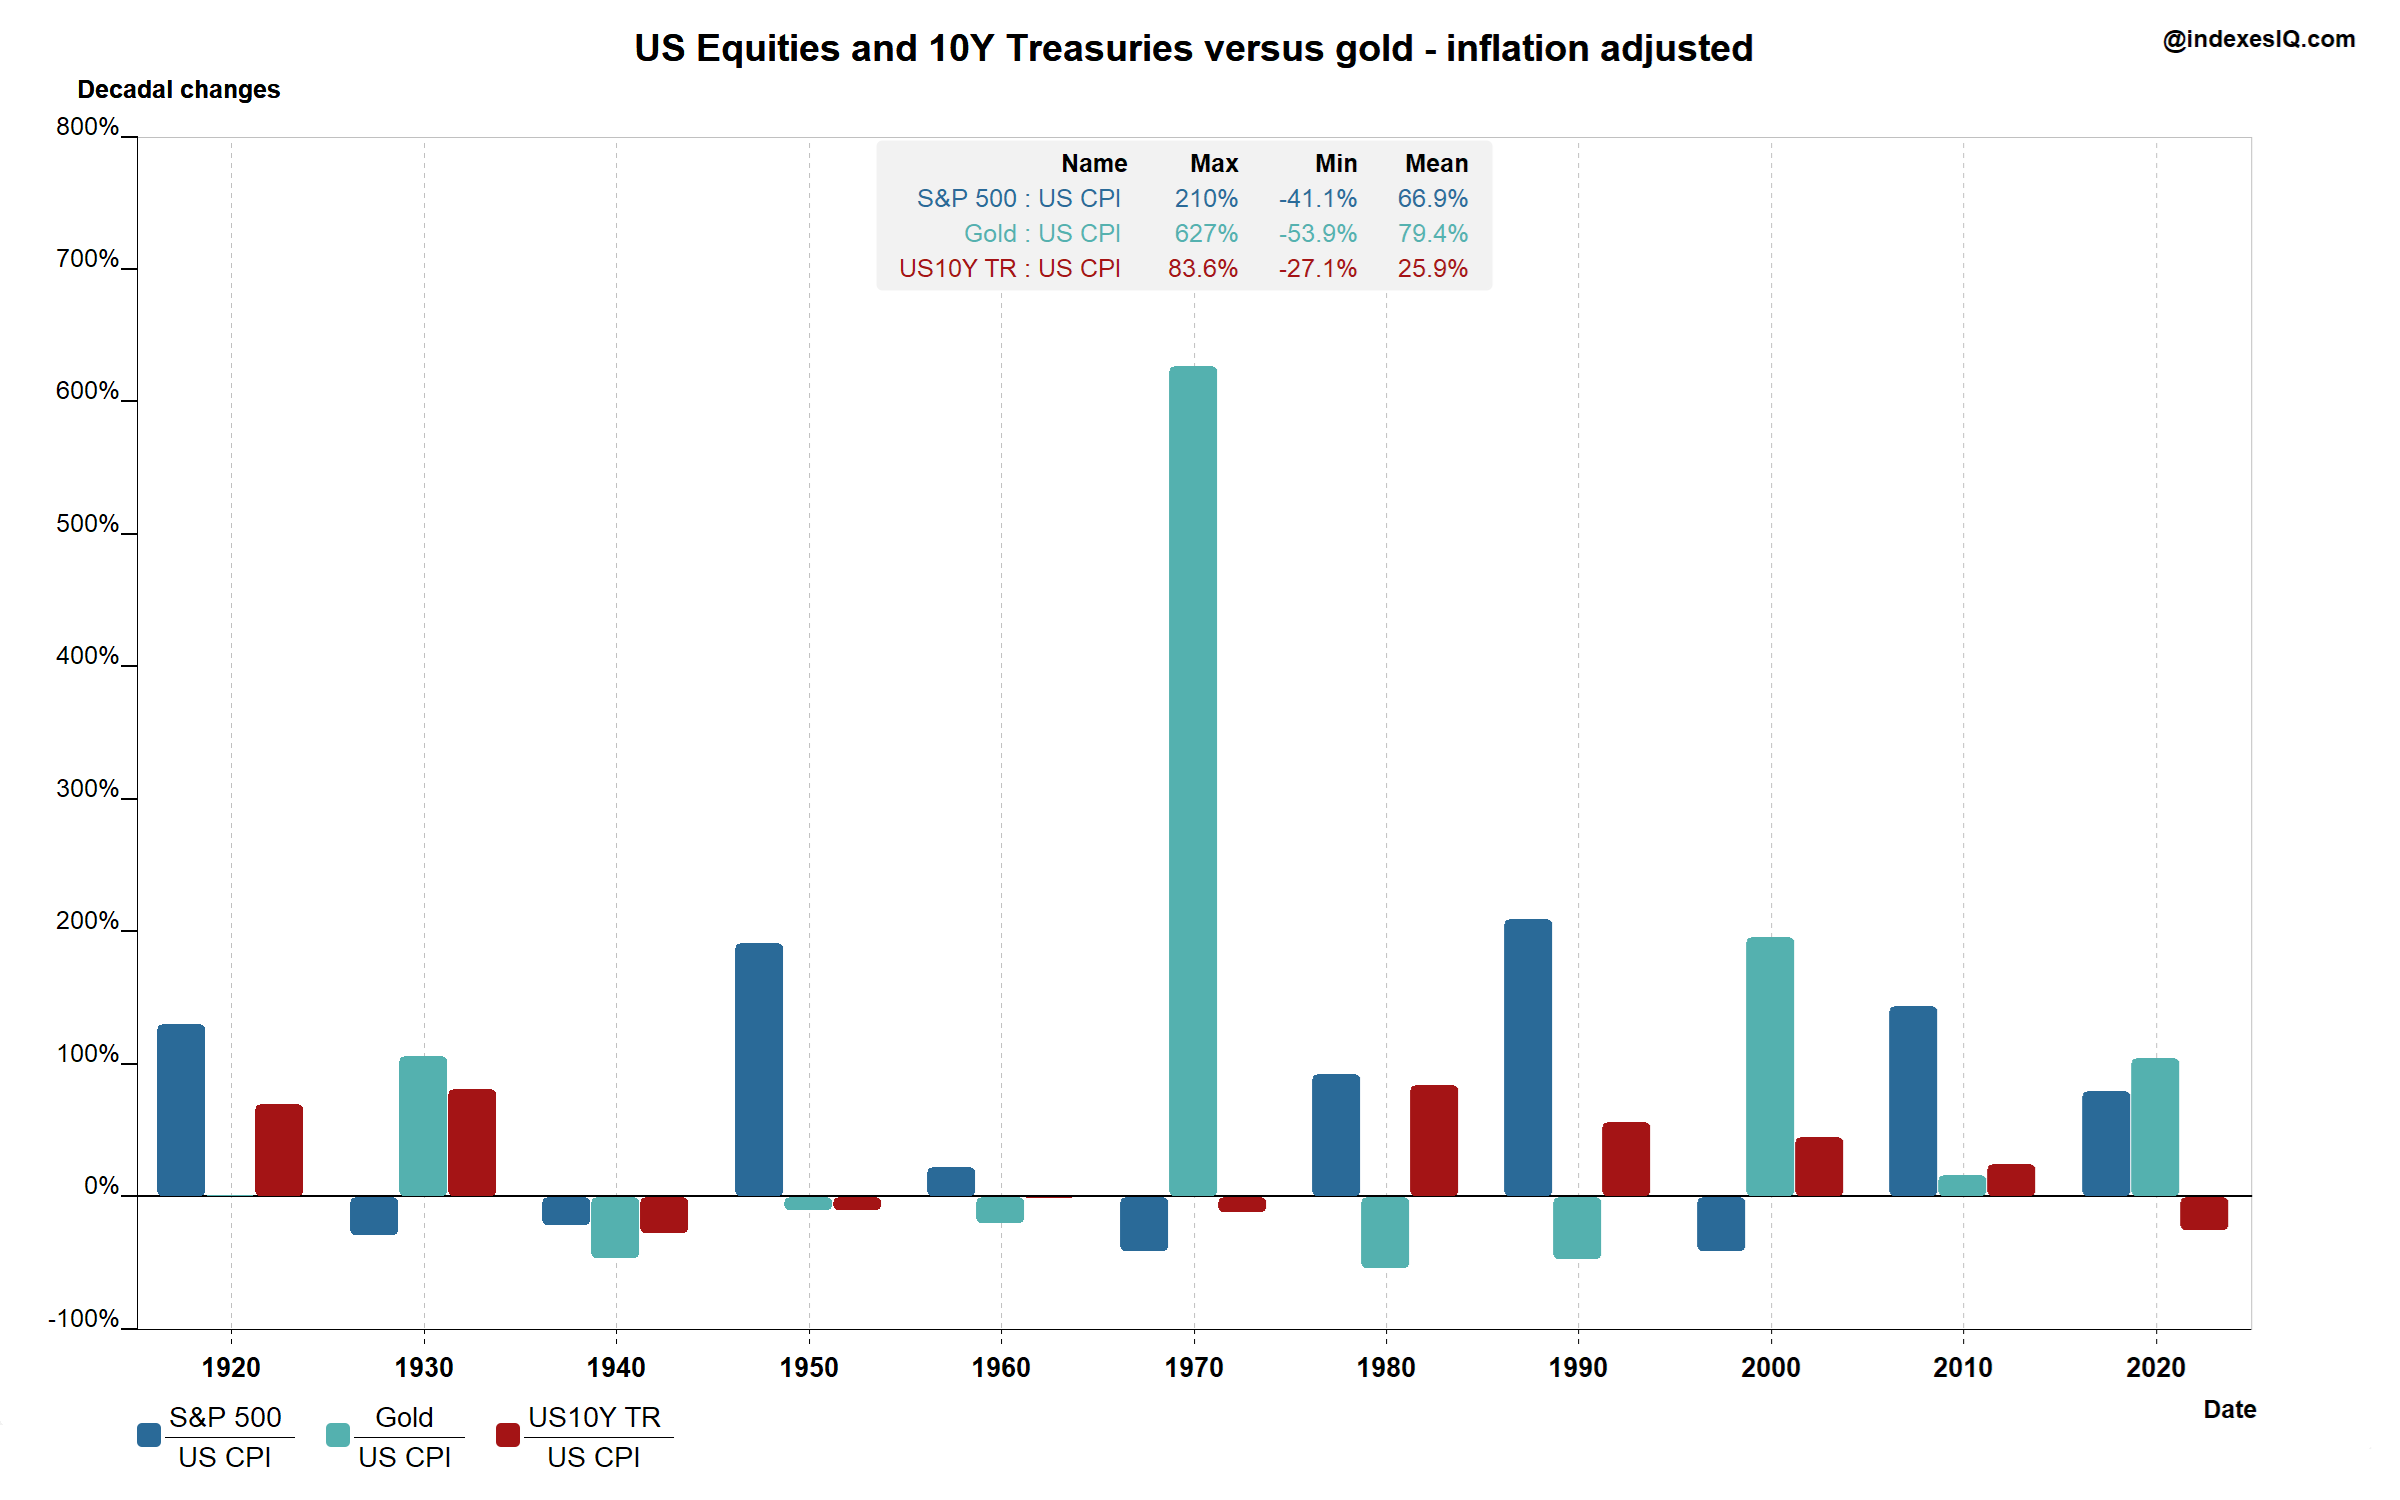
Performance Per Decade — Returns Are Not a Smooth Line
  • Compare the S&P 500, gold and US 10-year bonds decade by decade, inflation-adjusted, from the 1920s to the 2020s
  • Long-term returns differ dramatically decade by decade — some decades are negative
  • Gold had one outstanding decade (the 1970s); the S&P 500 had four negative decades in real terms
  • A powerful antidote to the illusion that long-term investing is always smooth or predictable
Download App
Underwater drawdown
Use Case 7
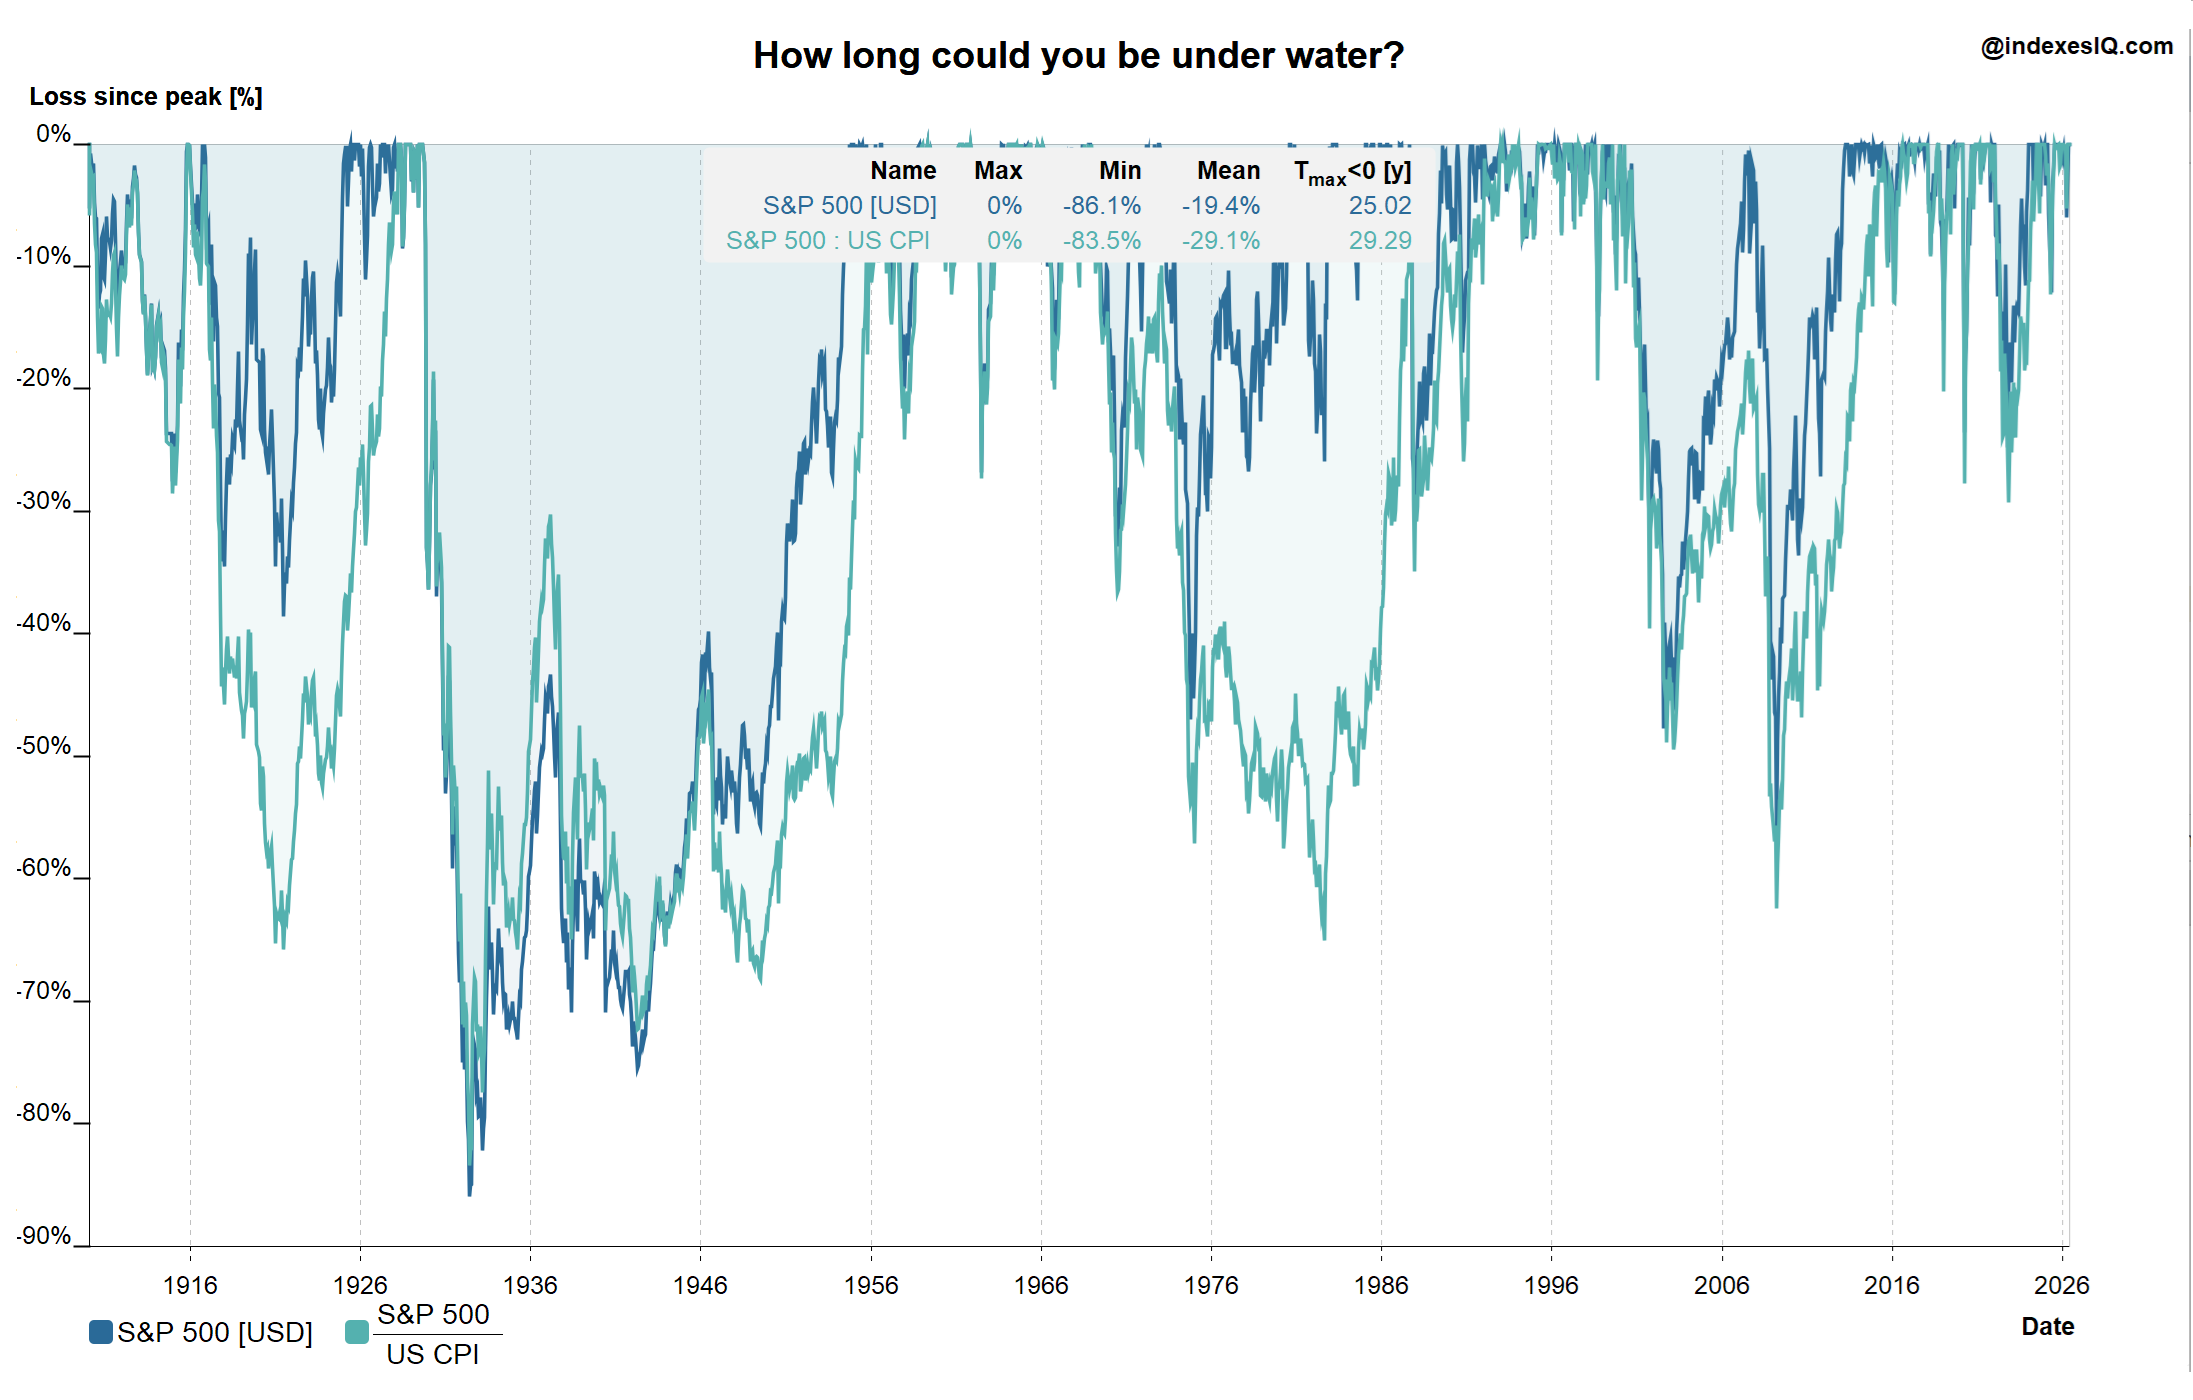
How long could you be under water?
  • Analyse how long it may take to recover from a market crash
  • Includes making up for inflation — not just nominal recovery
  • Compare recovery periods across markets and crises
  • Understand real long-term downside risk beyond simple volatility
Download App
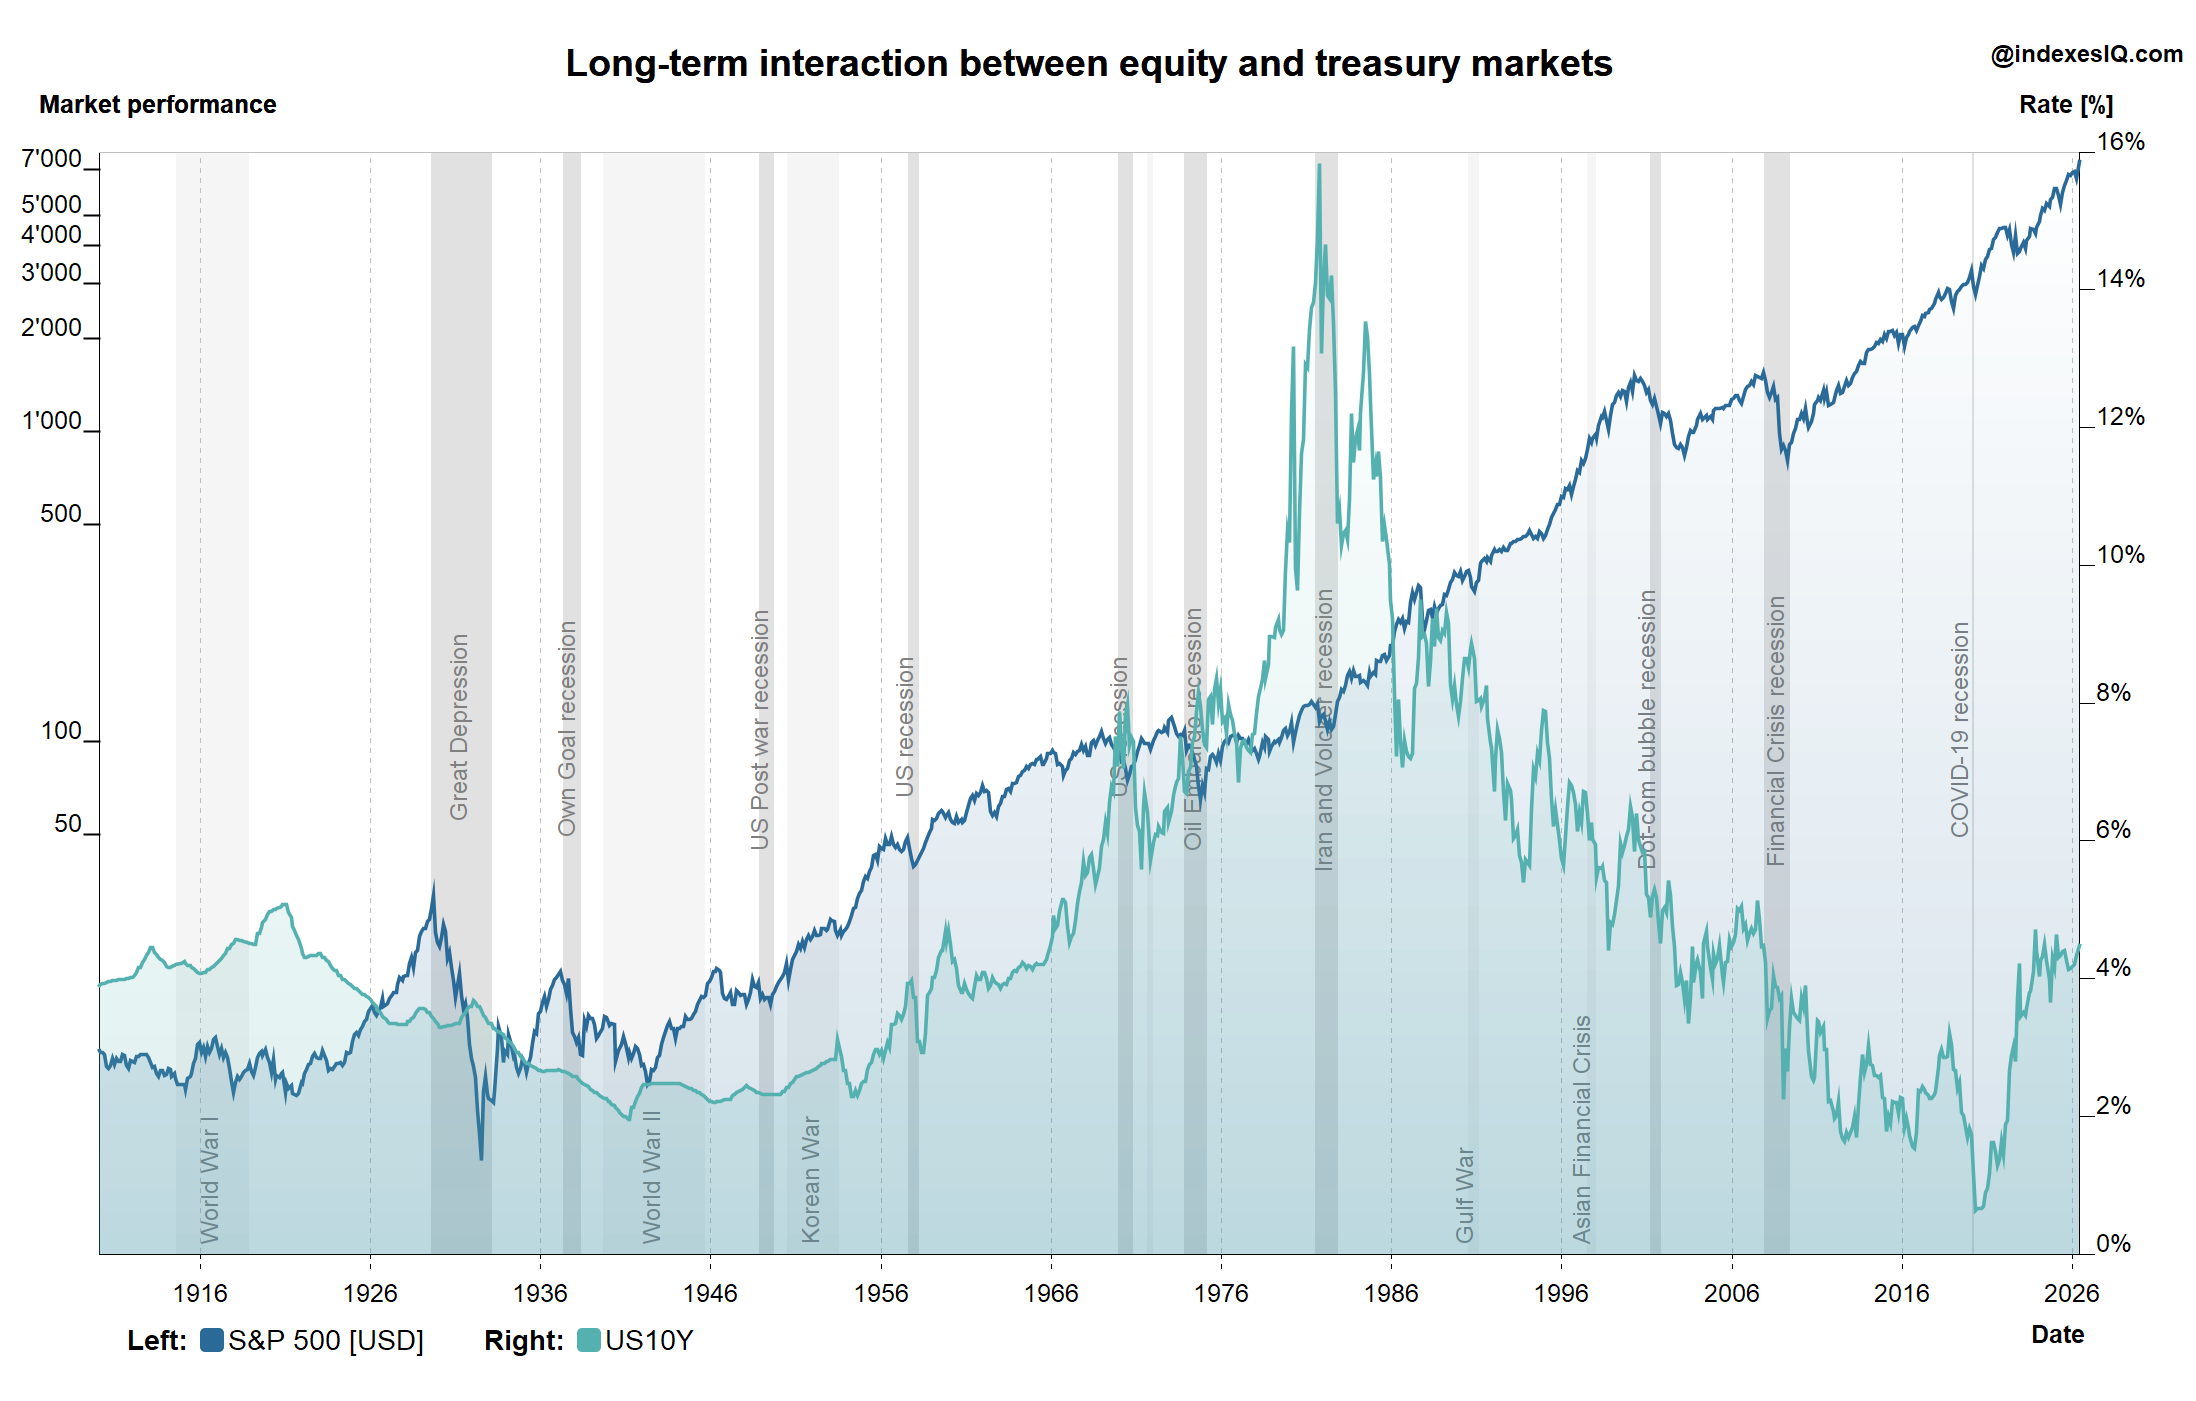
Equity and treasury
Use Case 8
Analyse the long-term interaction of equity and treasury markets
  • Understand how equity and bond markets move together over decades
  • Analyse behaviour during recessions and international crises
  • Visualise the flight-to-safety dynamic in real historical data
  • Analyse long-term treasury rate cycles and their interaction with equity markets
Download App
Correlation scatter VIX
Use Case 9
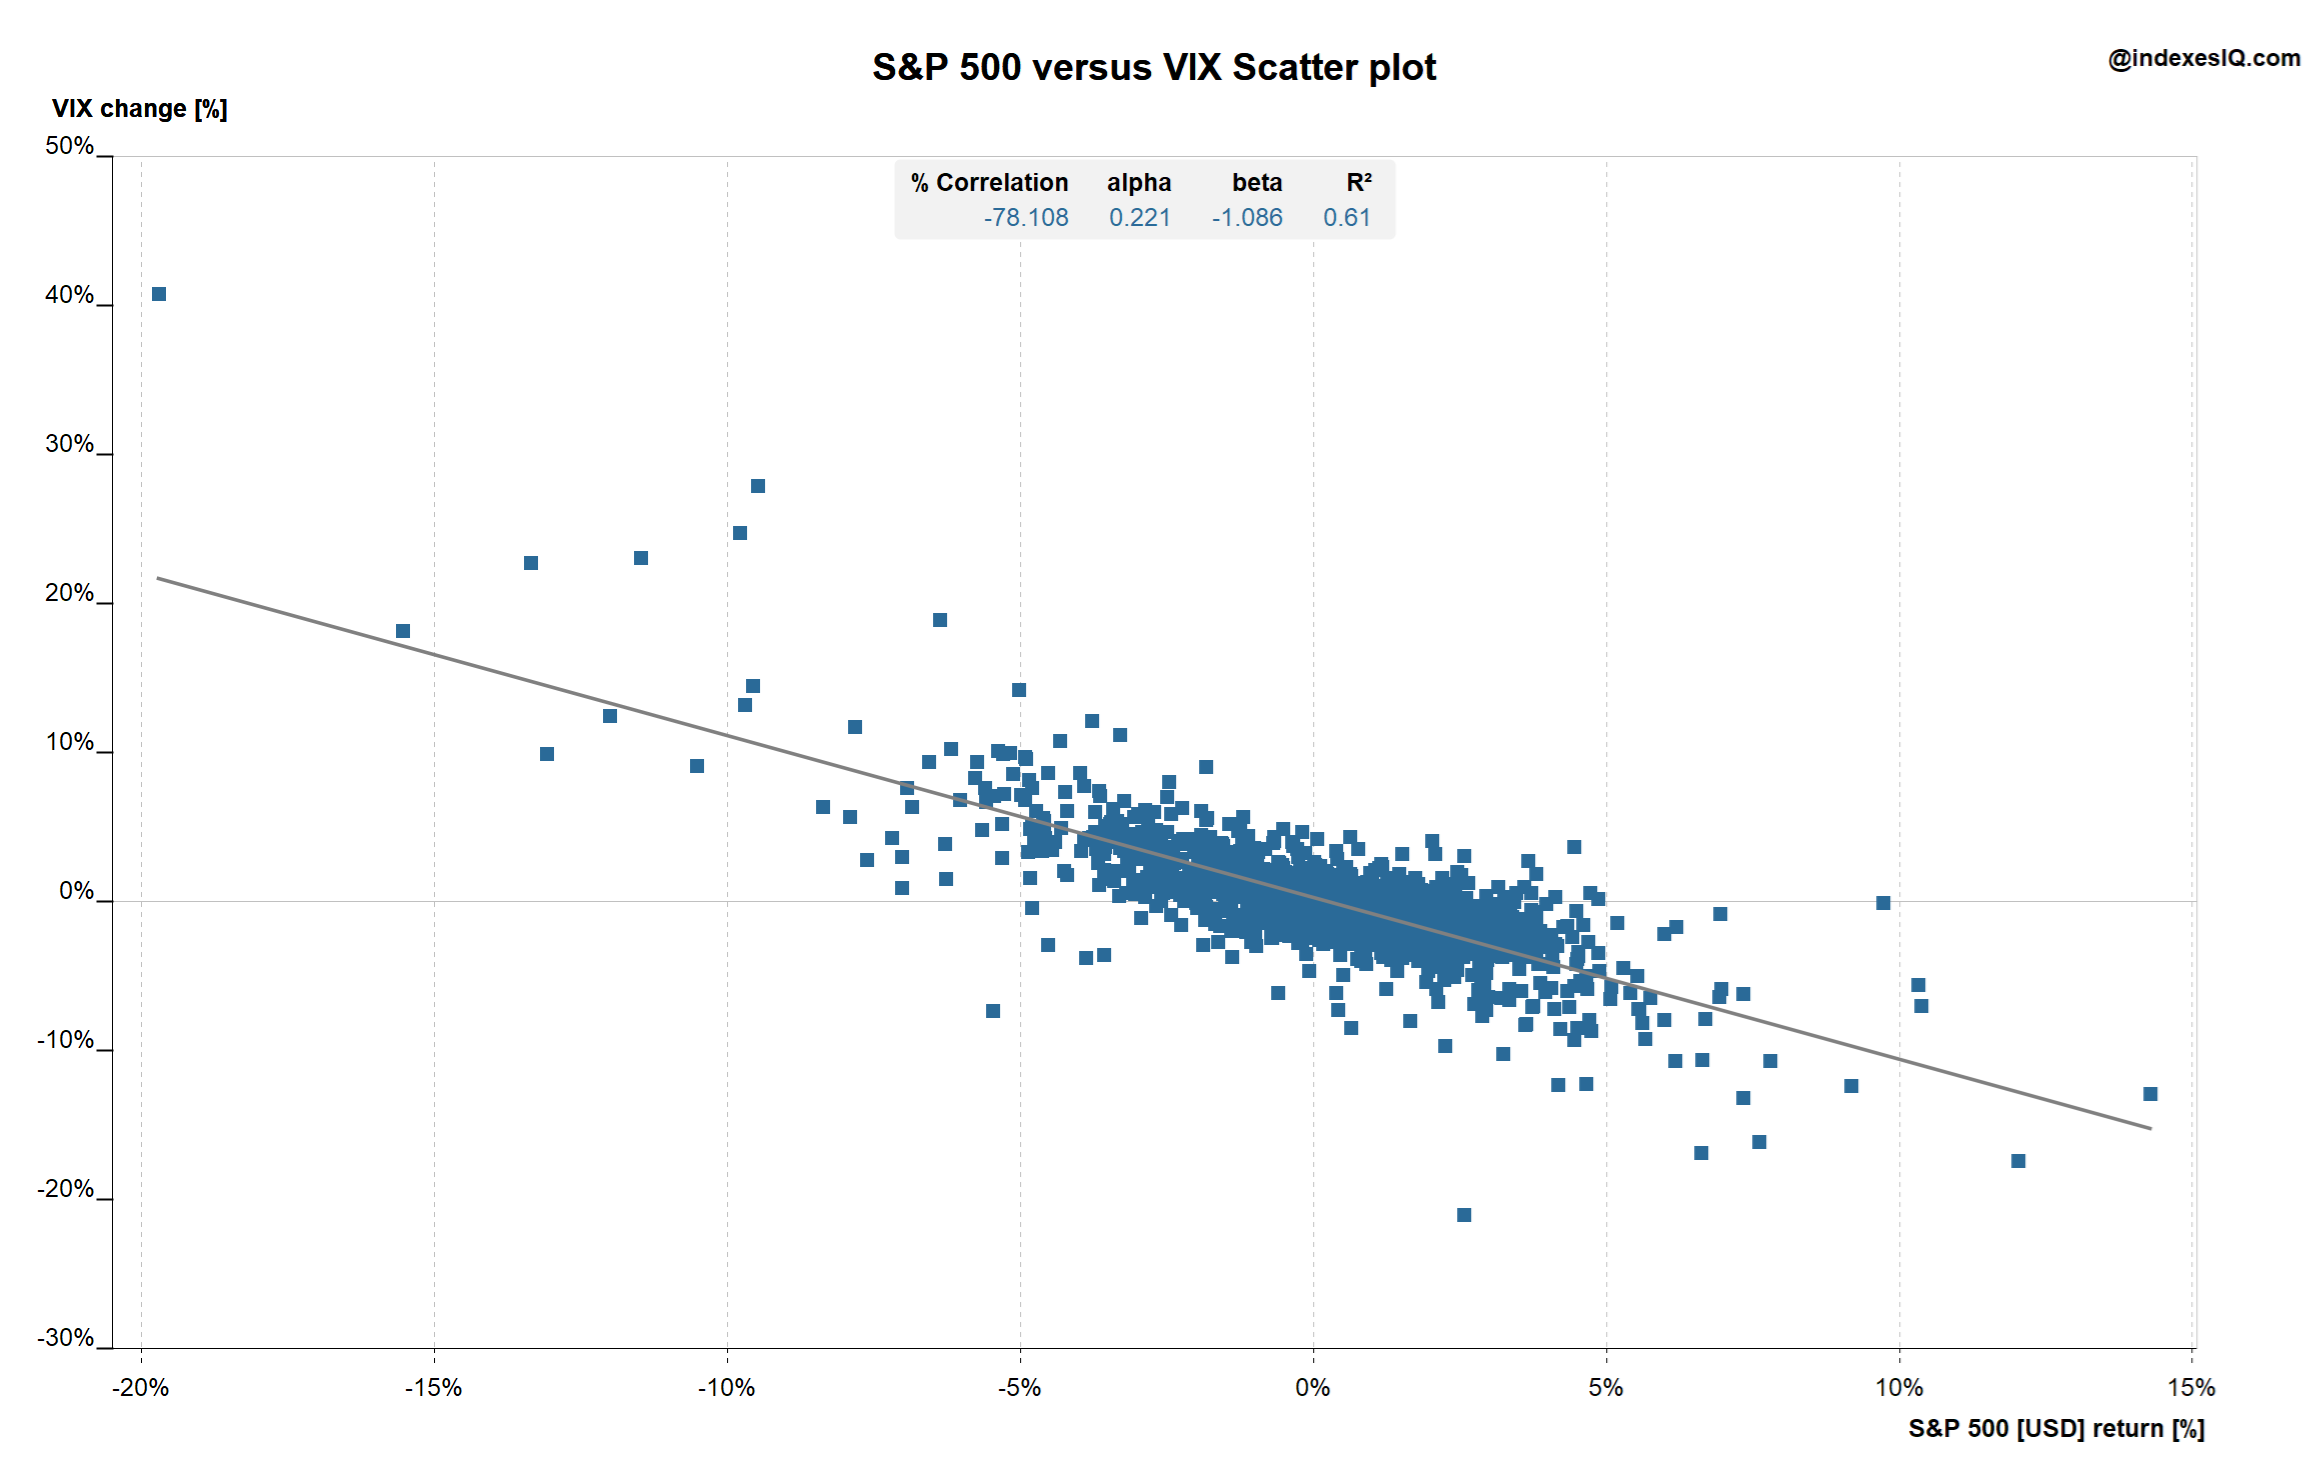
Correlation Analysis — S&P 500 vs the VIX
  • Scatter plot of S&P 500 returns vs changes in the VIX, with regression line
  • Correlation of -78% and R² of 61% — when the S&P 500 falls, the cost of protection rises sharply
  • Visualise the strength and consistency of the relationship between equity returns and volatility
  • Apply the same analysis to any two indexes in the tool
Download App
Return distribution
Use Case 10
Calculate return distributions and Value-at-Risk
  • Analyse and compare return distributions across markets
  • Calculate Value-at-Risk for weekly, monthly, quarterly or yearly returns
  • Identify fat tails and asymmetries in market return profiles
Download App
Benchmark risk and return
Use Case 11
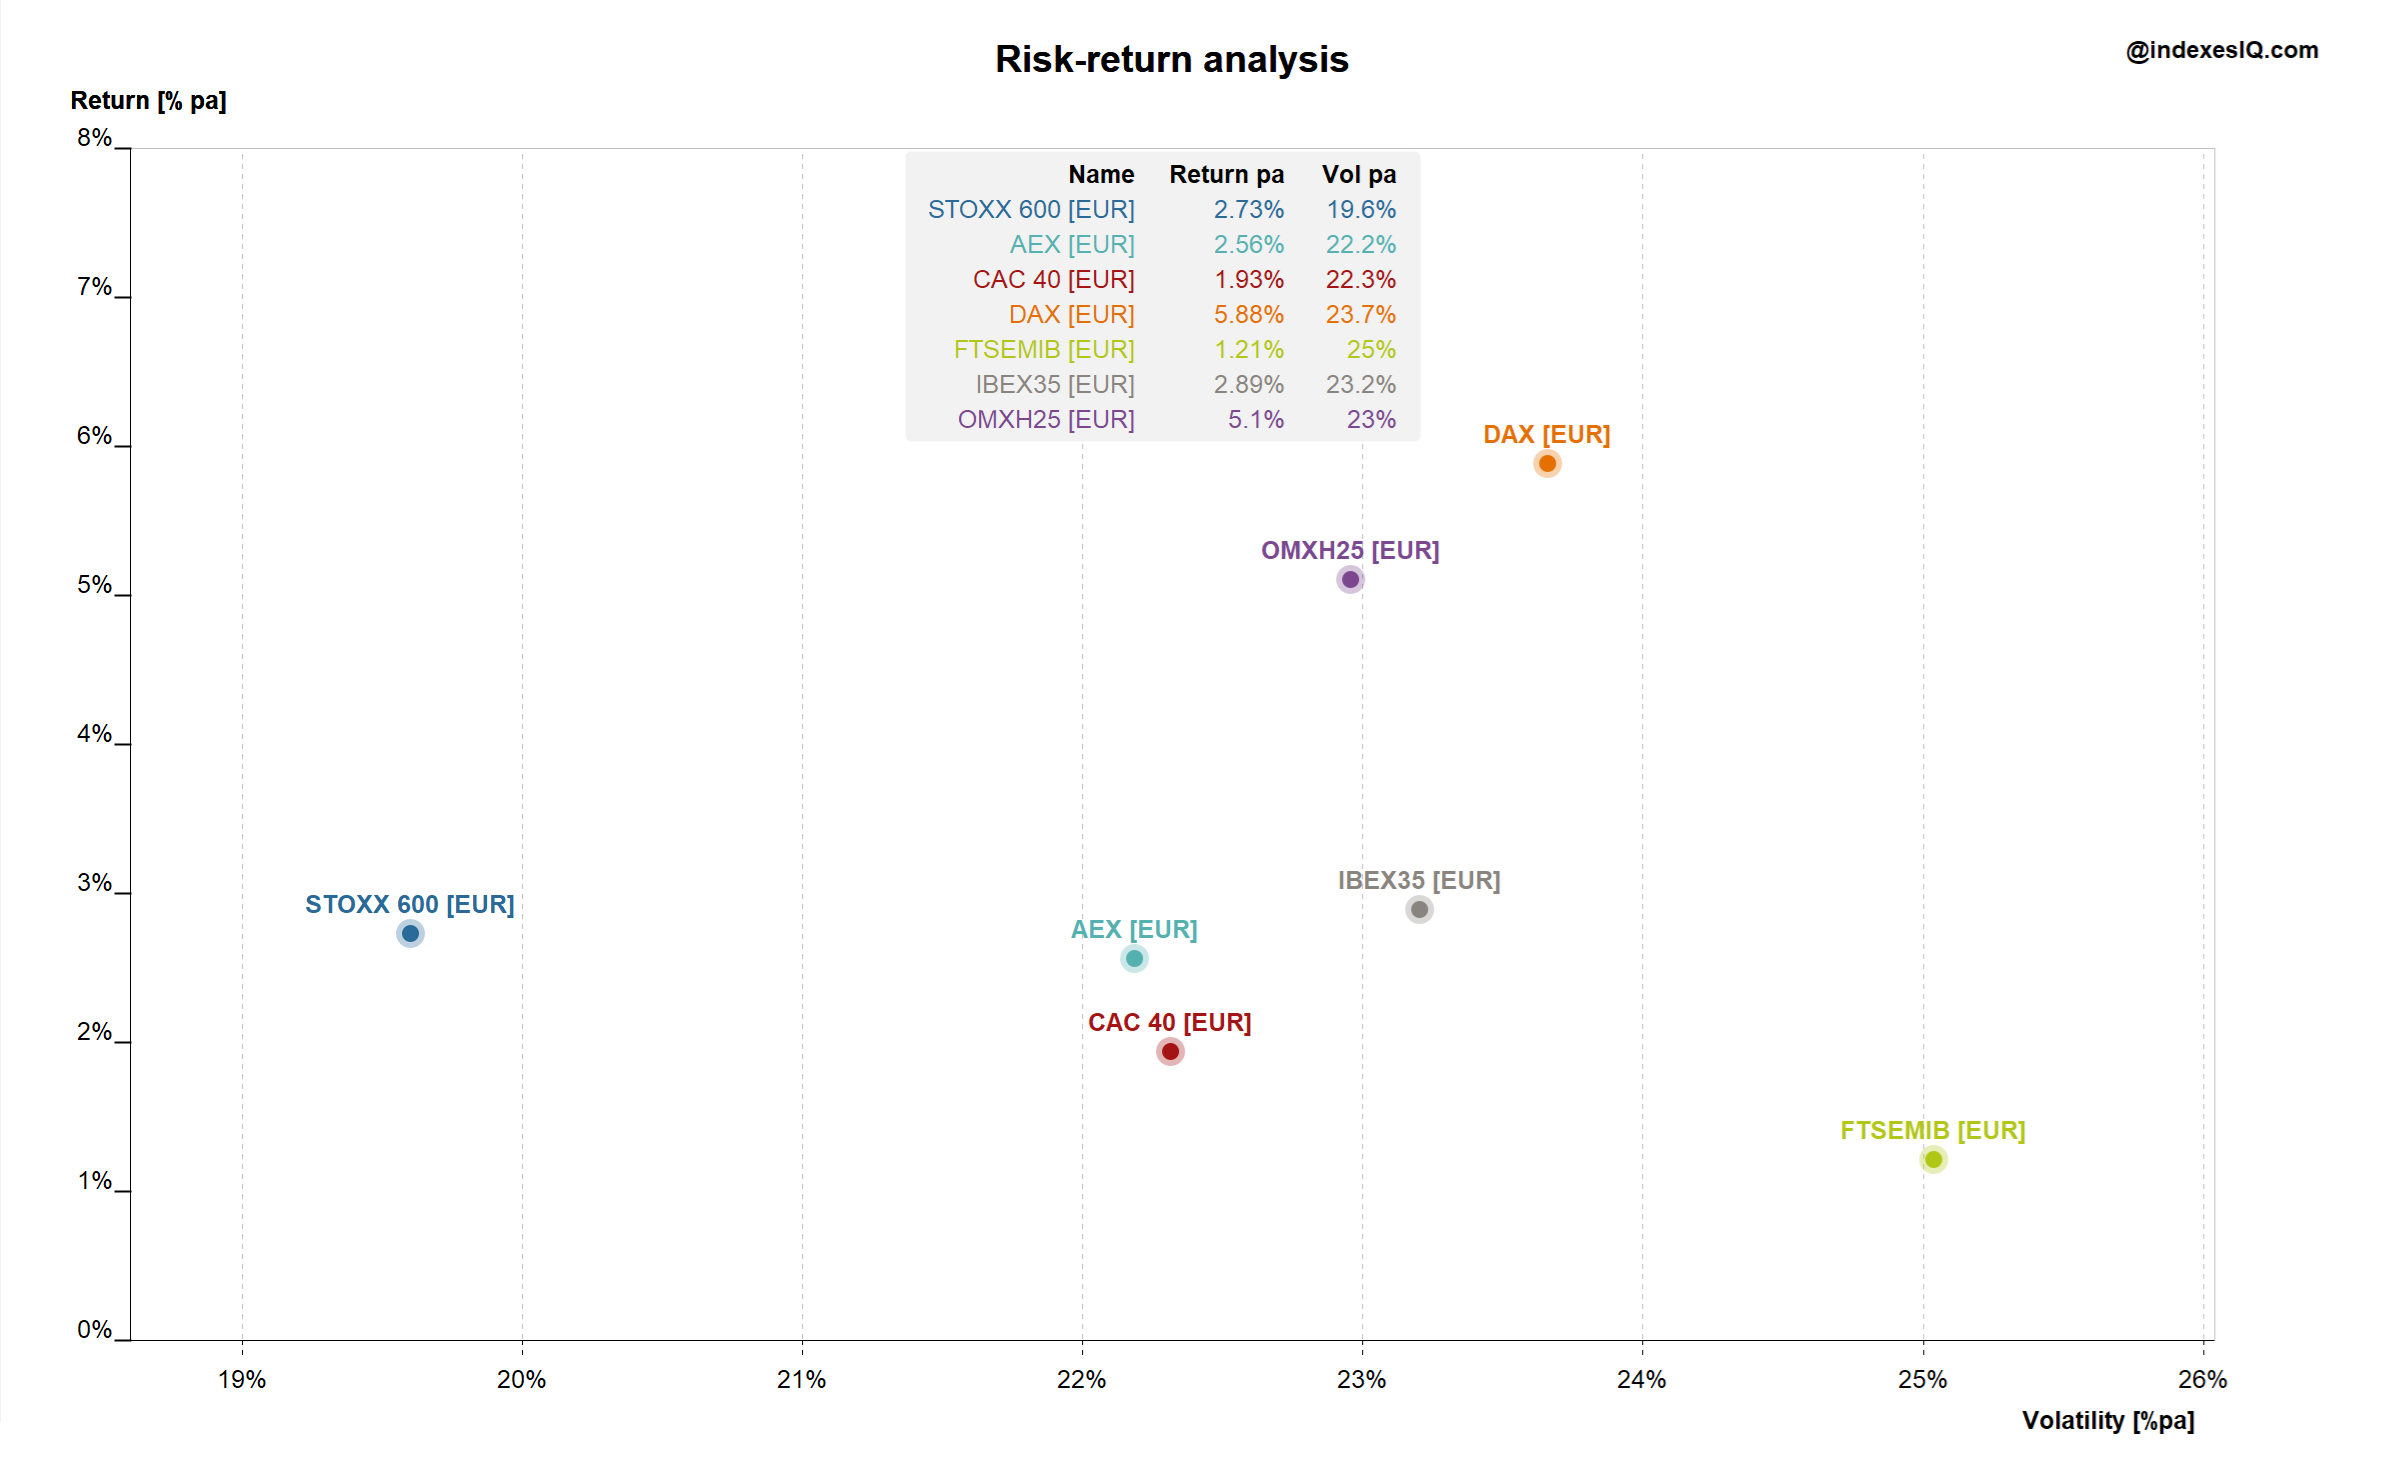
Benchmark Risk and Return Across Markets
  • Scatter plot of volatility vs return across European indexes — STOXX 600, DAX, CAC 40, OMX25, AEX, FTSEMIB, IBEX 35
  • Instantly see which markets delivered the best return per unit of risk
  • Identify outliers — high risk with low return, or low risk with strong return
  • Note: DAX is a total return index — adjust for dividends when comparing
Download App
Derivative pay-offs
Use Case 12
Analyse derivative strategy pay-offs
  • Explore pay-off profiles across all major derivative strategy categories
  • Capital protection, yield enhancement, participation and leverage
  • Understand how the pay-off of a derivative changes during its lifetime
Download App
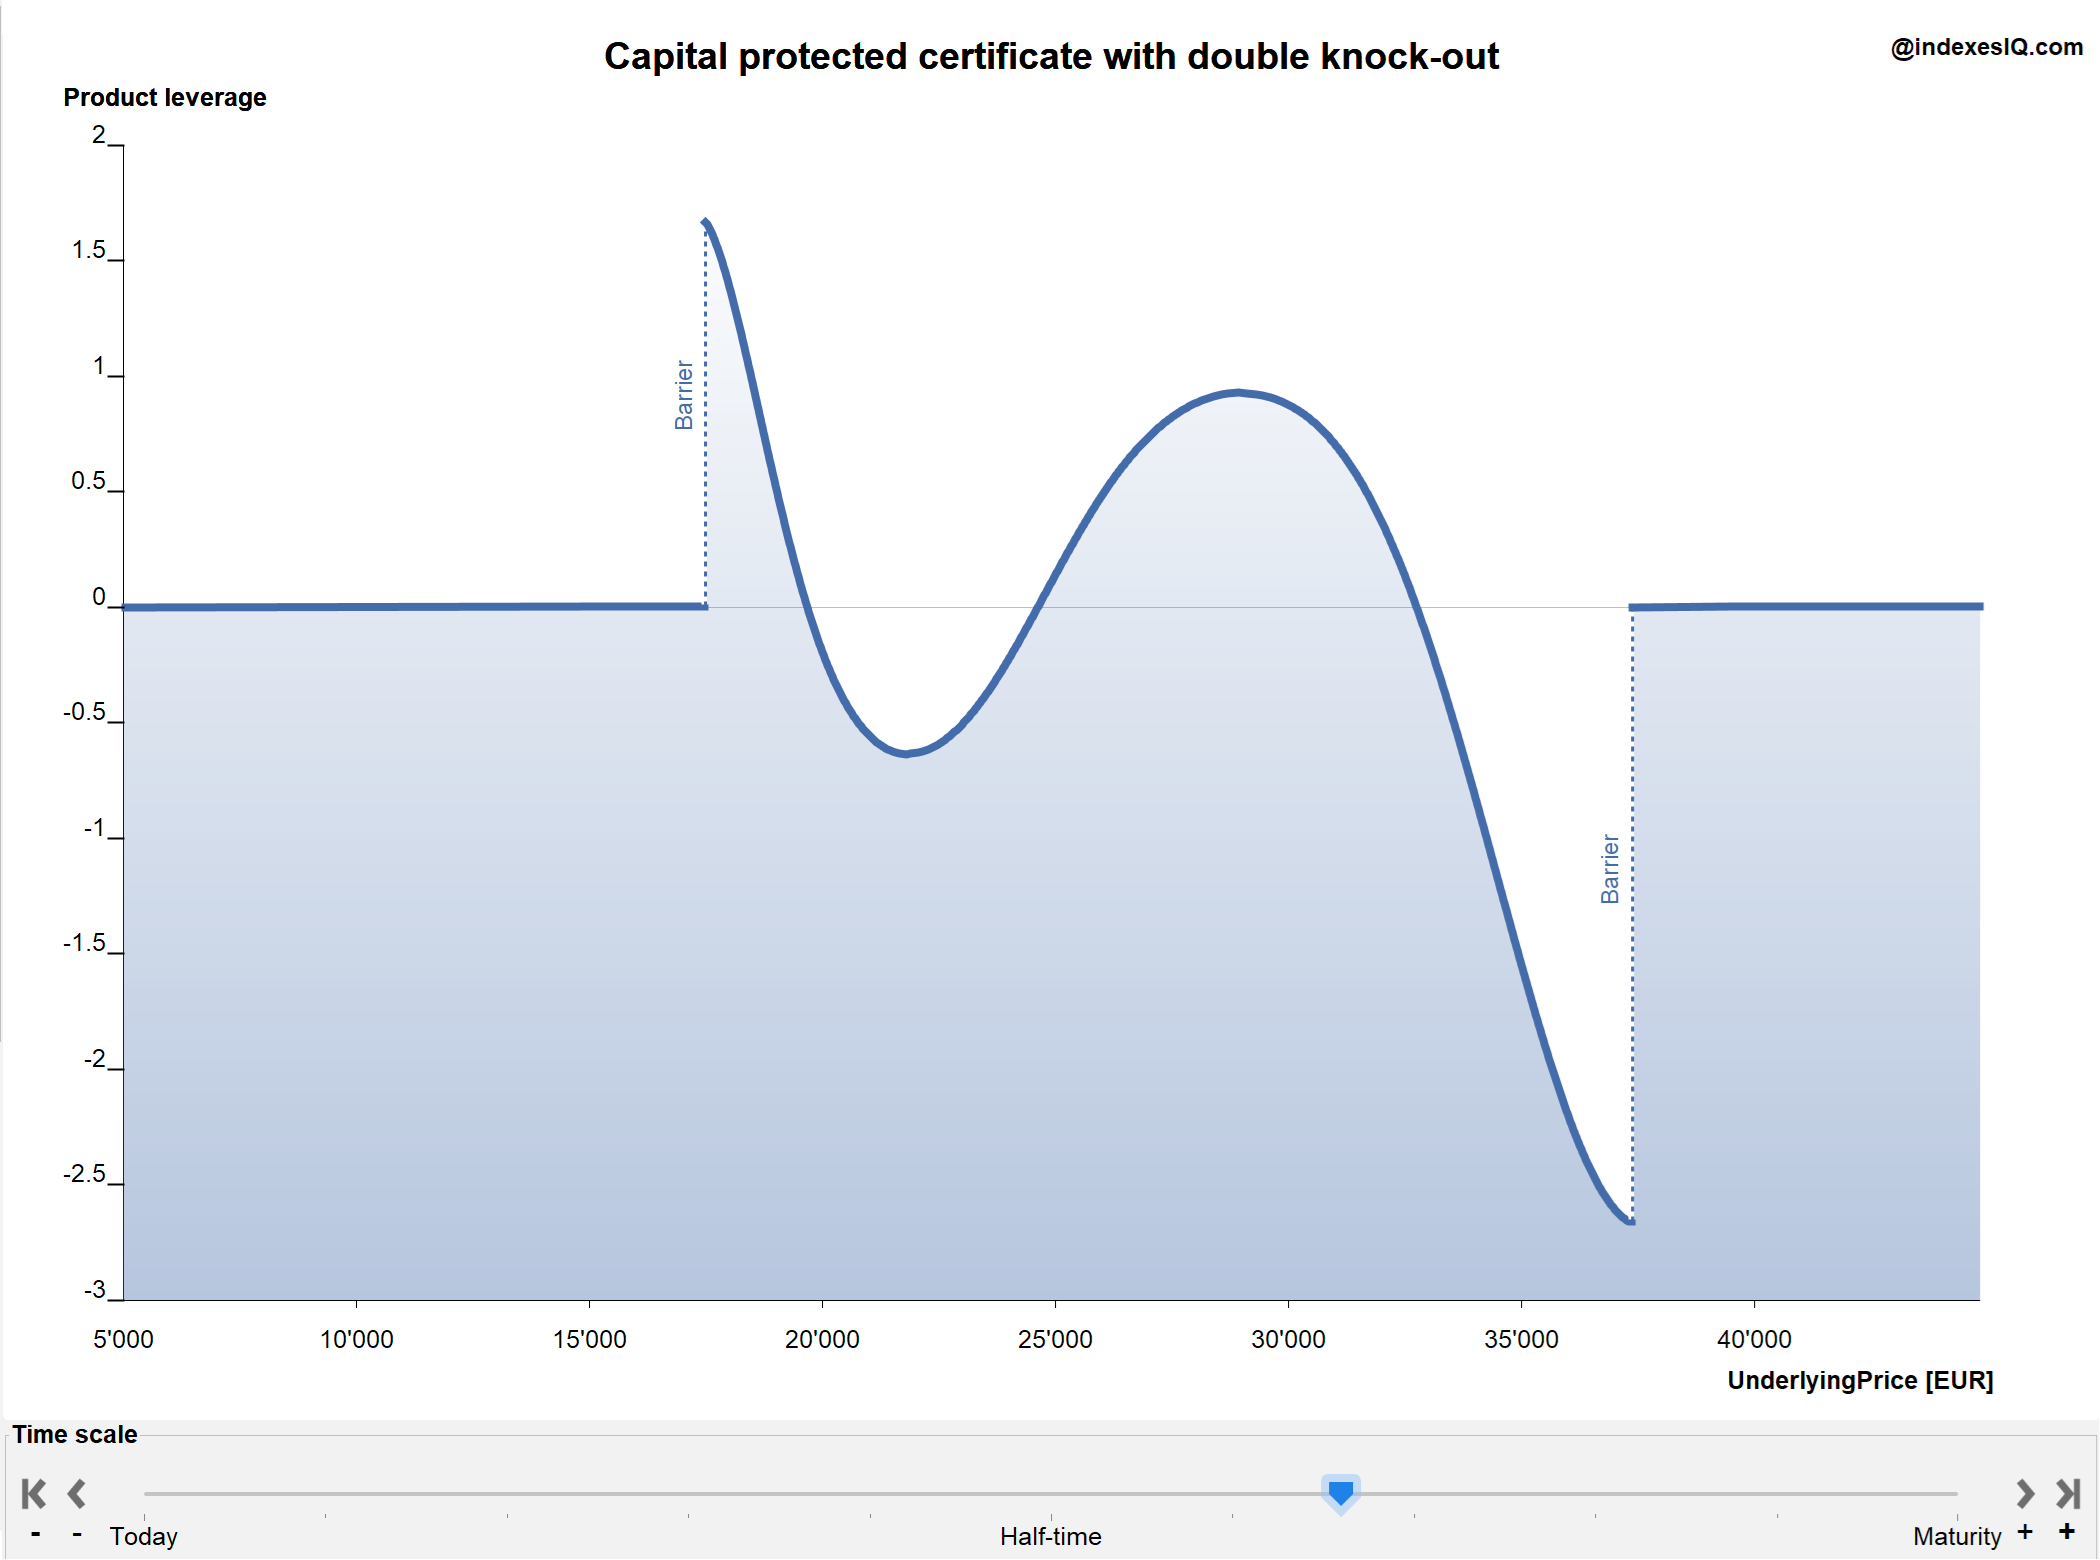
Degree of leverage
Use Case 13
Analyse the Degree of Leverage of a Derivative Strategy
  • Chart the leverage of a capital protected certificate with double knock-out as a function of the underlying price
  • Leverage = % change in product price ÷ % change in underlying price
  • See large variations and discontinuities in leverage as the underlying moves
  • Use the time-machine function to see how leverage changes during the product's lifetime
Download App
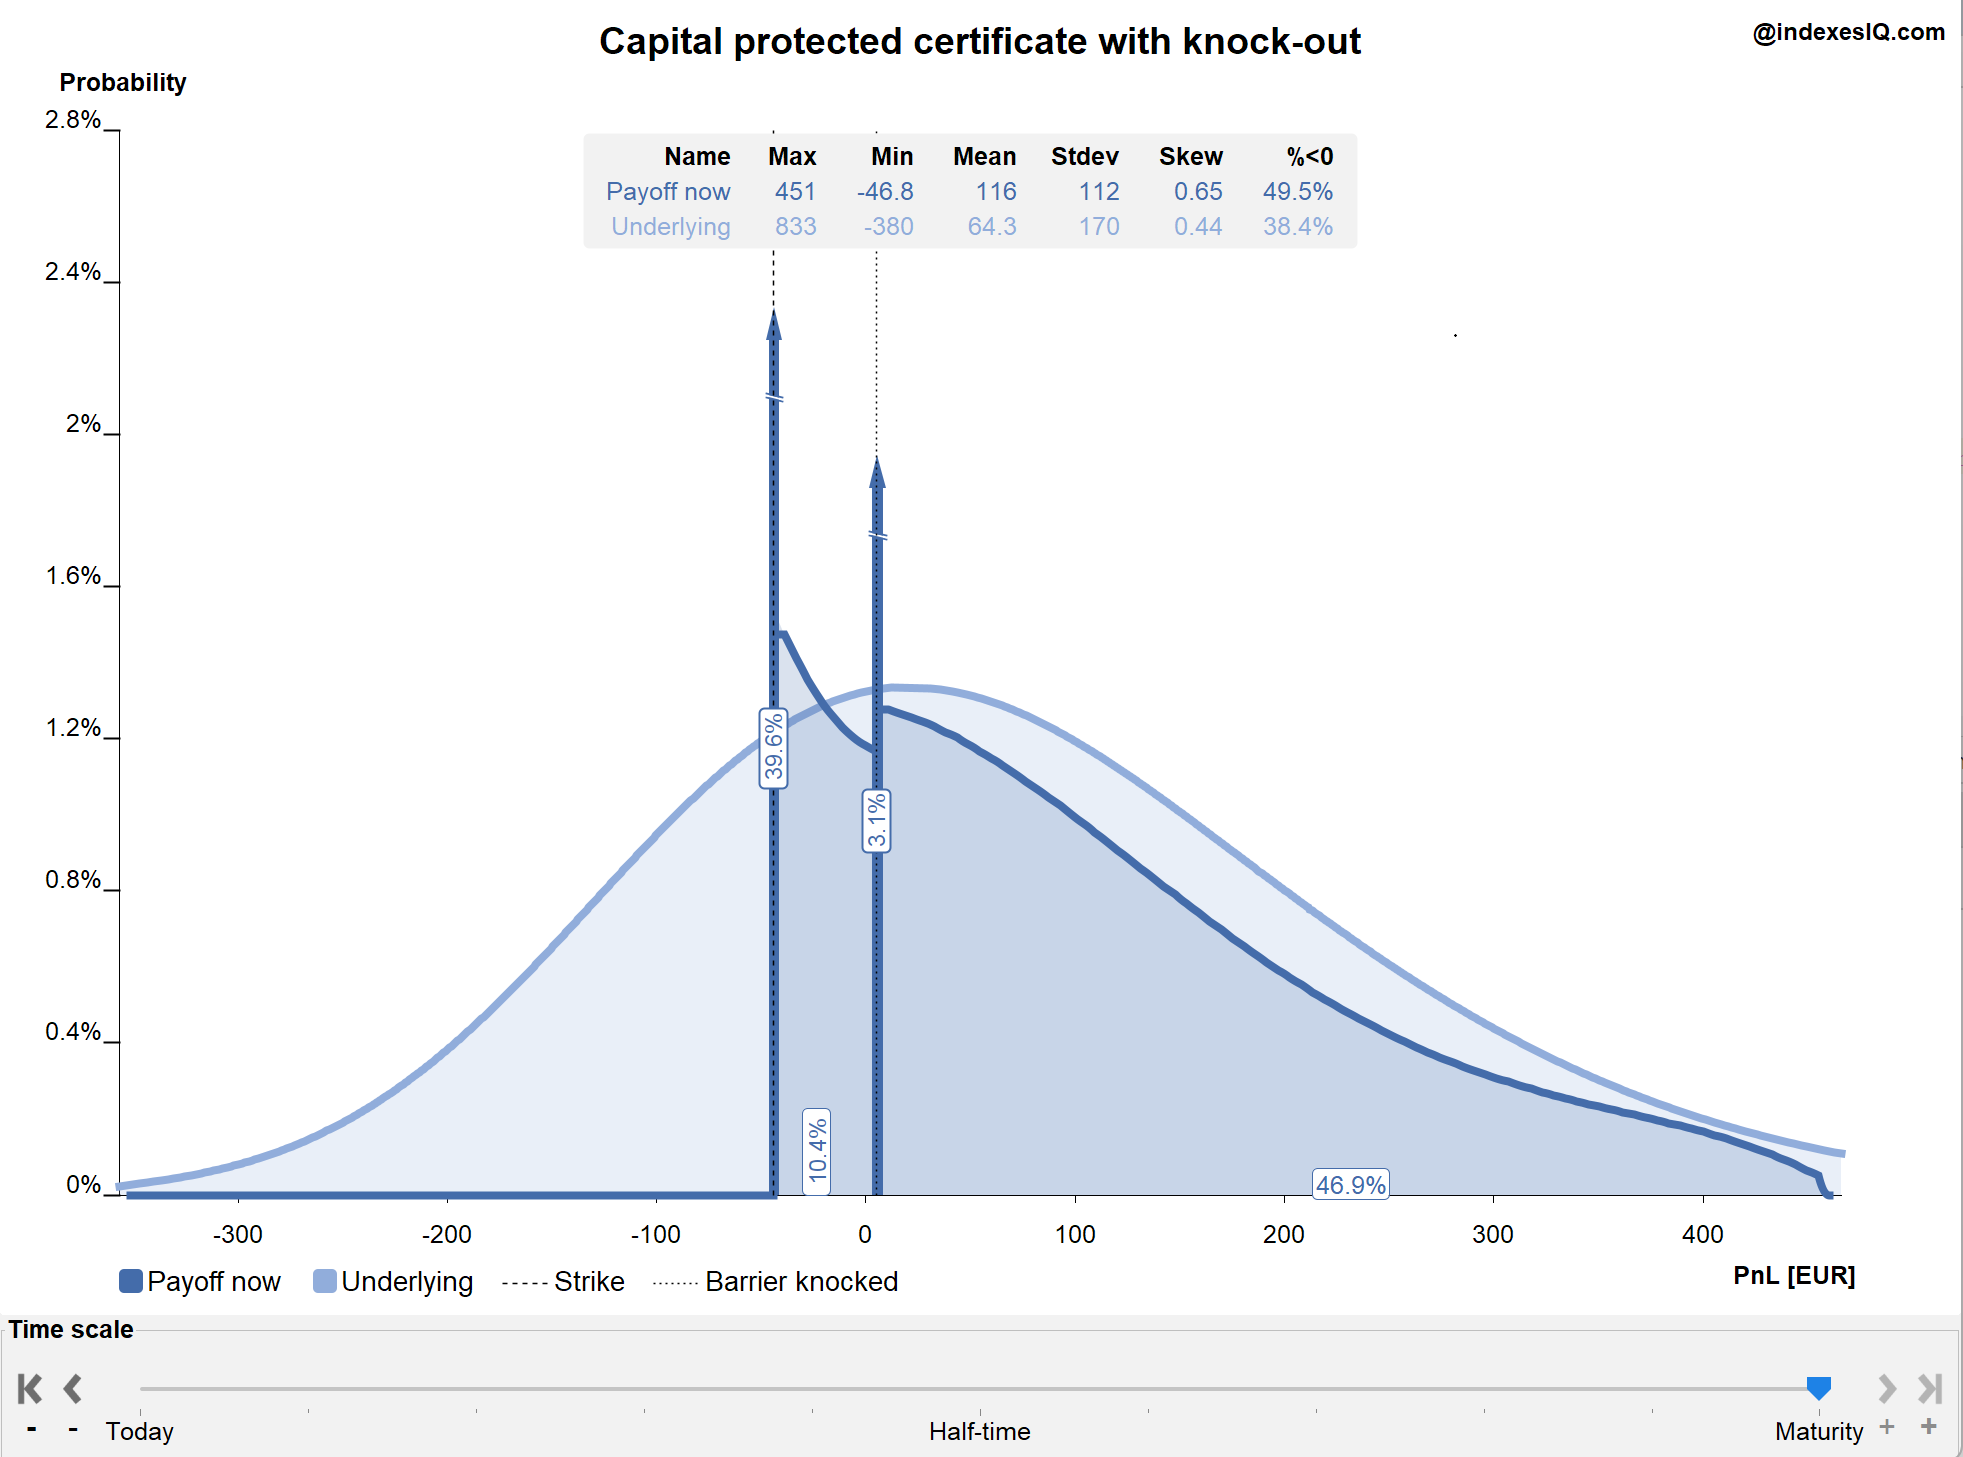
Derivative simulation
Use Case 14
Simulate return distributions of complex derivative strategies
  • Simulate return profiles against the underlying asset's return distribution
  • Understand where discrete probability spikes occur
  • Use the time-machine function to see how distributions change during the derivative's lifetime
Download App
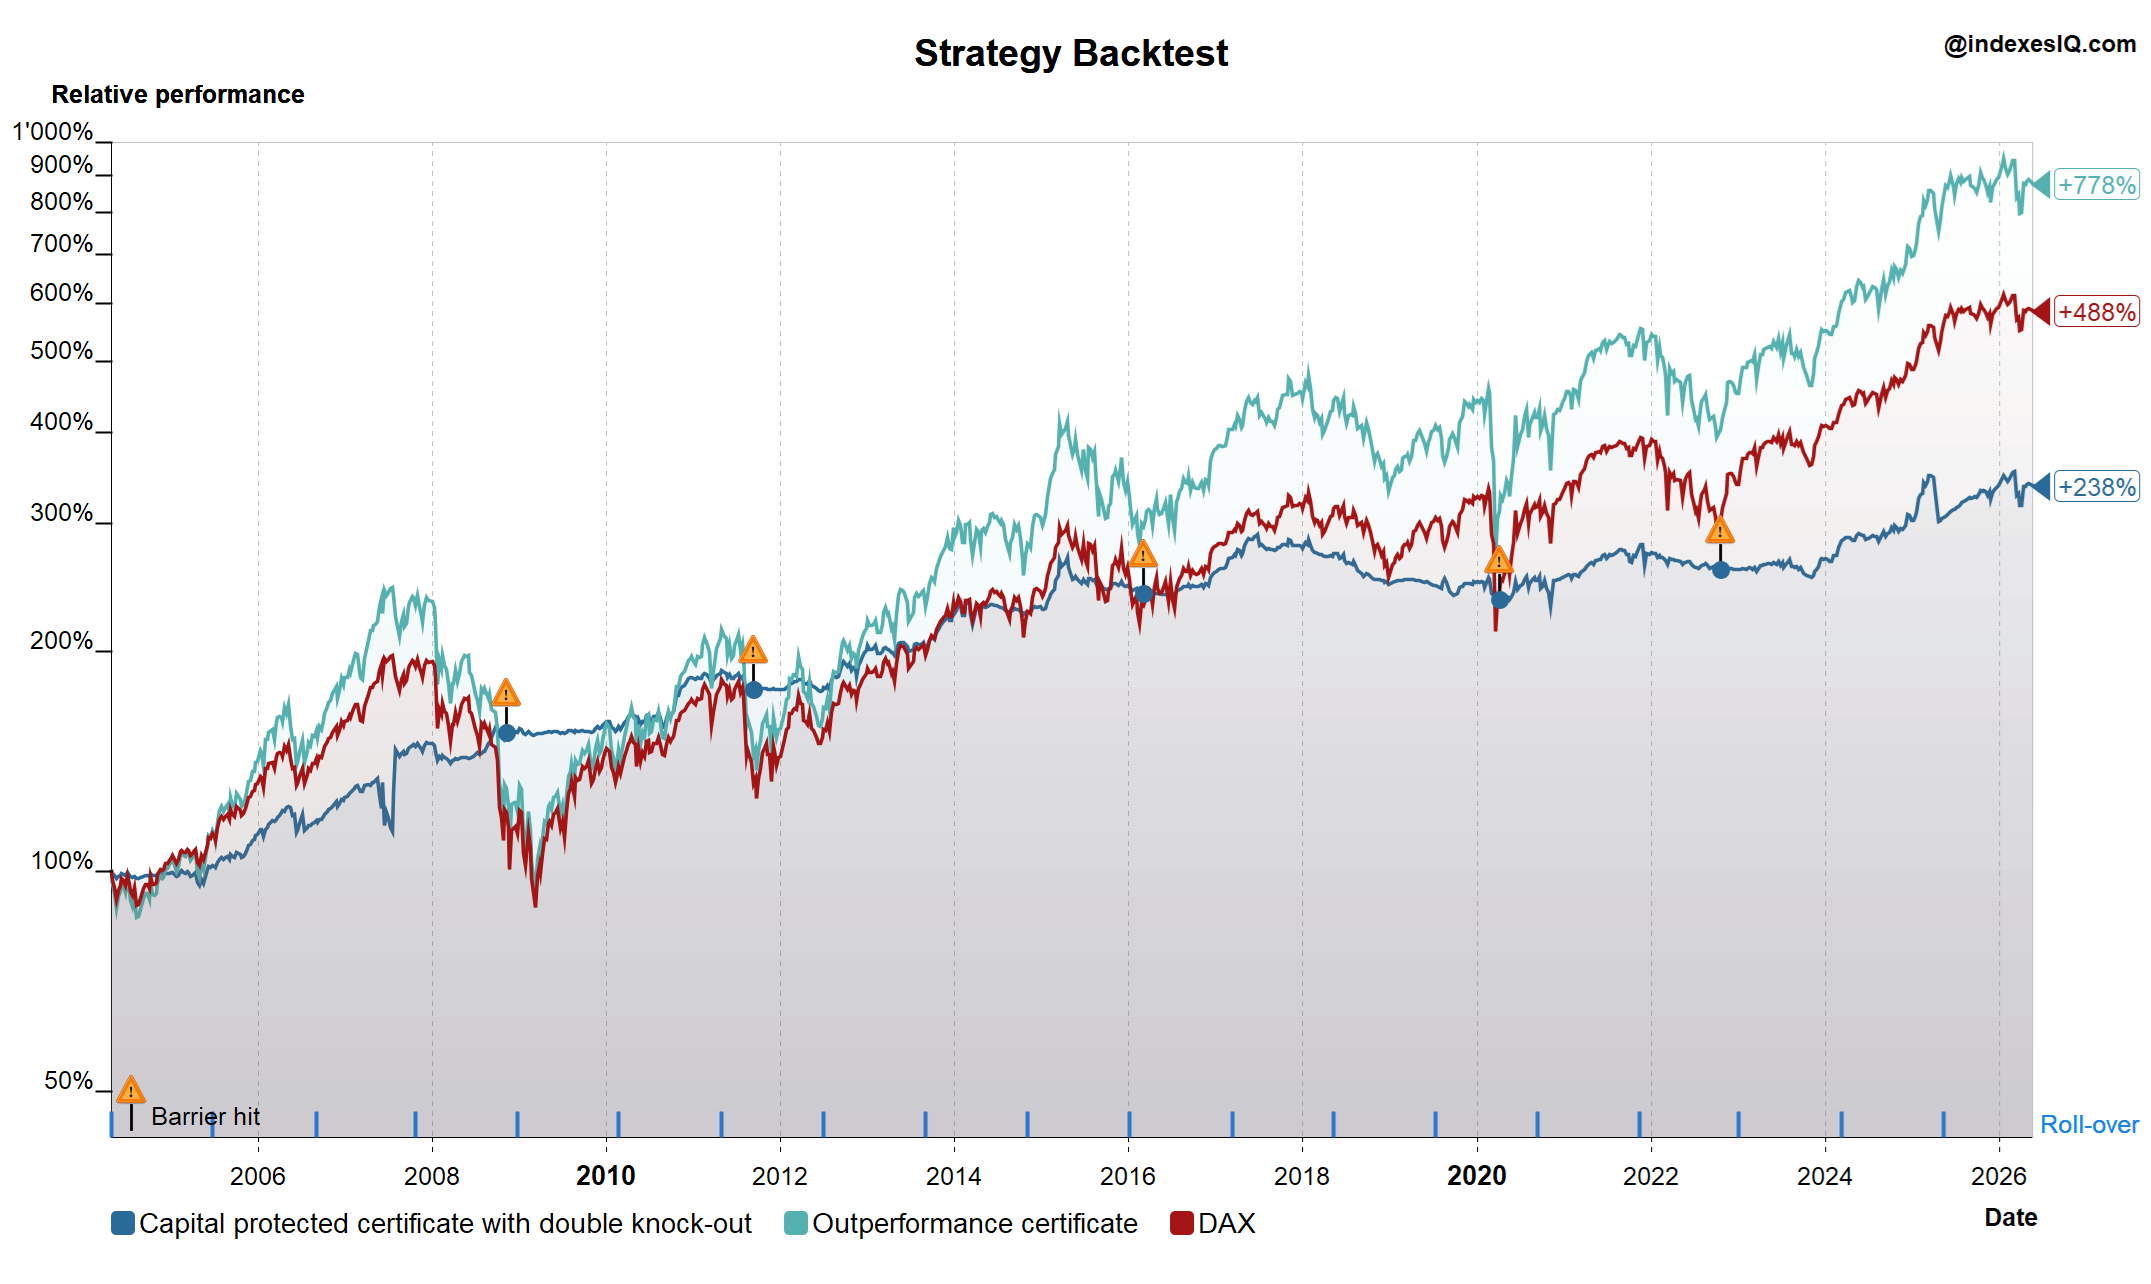
Backtest
Use Case 15
Backtest derivative strategies over time
  • Simulate frequent roll-overs with full product rebuilds at each roll date
  • Simulate barrier hits over the full backtest period
  • Compare multiple strategies simultaneously against the underlying
  • Compare performance, risk and tracking error relative to the underlying
Download App
IndexesIQ — A better lens on global financial markets
Loading…
© 2026 IndexesIQ.com  ·  Free educational resource for index investing  ·  Not financial advice. For educational purposes only.  ·  Follow us on LinkedIn
IndexesIQ Logo

IndexesIQ — A Better Lens on Global Financial Markets

100+ years of market history — risk, performance, cycles and derivative strategies across 80+ indexes.

Index Performance Risk & Correlations Derivative Strategies Long-Term Investing
The online app may take a moment to load. For better performance & graphics, download our free desktop app
Interactive Index Analysis Tool
Loading application…

Screen Too Small

The IndexesIQ analysis tool is designed for laptops and desktop screens.

Please visit us on a laptop or desktop, or download our free Windows app.

Download for Windows

Download the IndexesIQ Desktop App

A better lens on global financial markets — faster, sharper and more powerful than the browser version.

IndexesIQ for Windows

The desktop app delivers faster performance, sharper graphics and a more responsive experience. It connects to our servers on startup, so you always get the latest data.

Download for Windows
Please read before downloadingIndexesIQ is a free tool provided without any commercial guarantee or liability. It is not available through the official Microsoft Store. The app is safe to use but may trigger a Windows security warning — see the installation steps below.

How to Install

1
Click "Download for Windows" above — the installer IndexesIQ-Windows-Installer.msi will download to your Downloads folder.
2
Double-click the installer. Windows may show a security warning. This is normal for independent software.
3
If you see "Windows protected your PC": click "More info" then "Run anyway".
4
If Windows Smart App Control blocks the app (Windows 11): go to Settings → Privacy & Security → App & Browser Control → Smart App Control and set to "Off". Then re-run the installer.
5
Follow the installation wizard. IndexesIQ will appear in your Start Menu.
6
Launch from the Start Menu. The app connects to our servers on startup — please ensure you have an internet connection.
7
To uninstall: Settings → Apps → Installed Apps → search IndexesIQ → Uninstall.

Having trouble? Visit www.indexesiq.com or use the browser version above.