
Insights — The Long Game
Monthly perspectives on long-term index investing — data-driven, independent and free.
Central Banks at the Fork in the Road
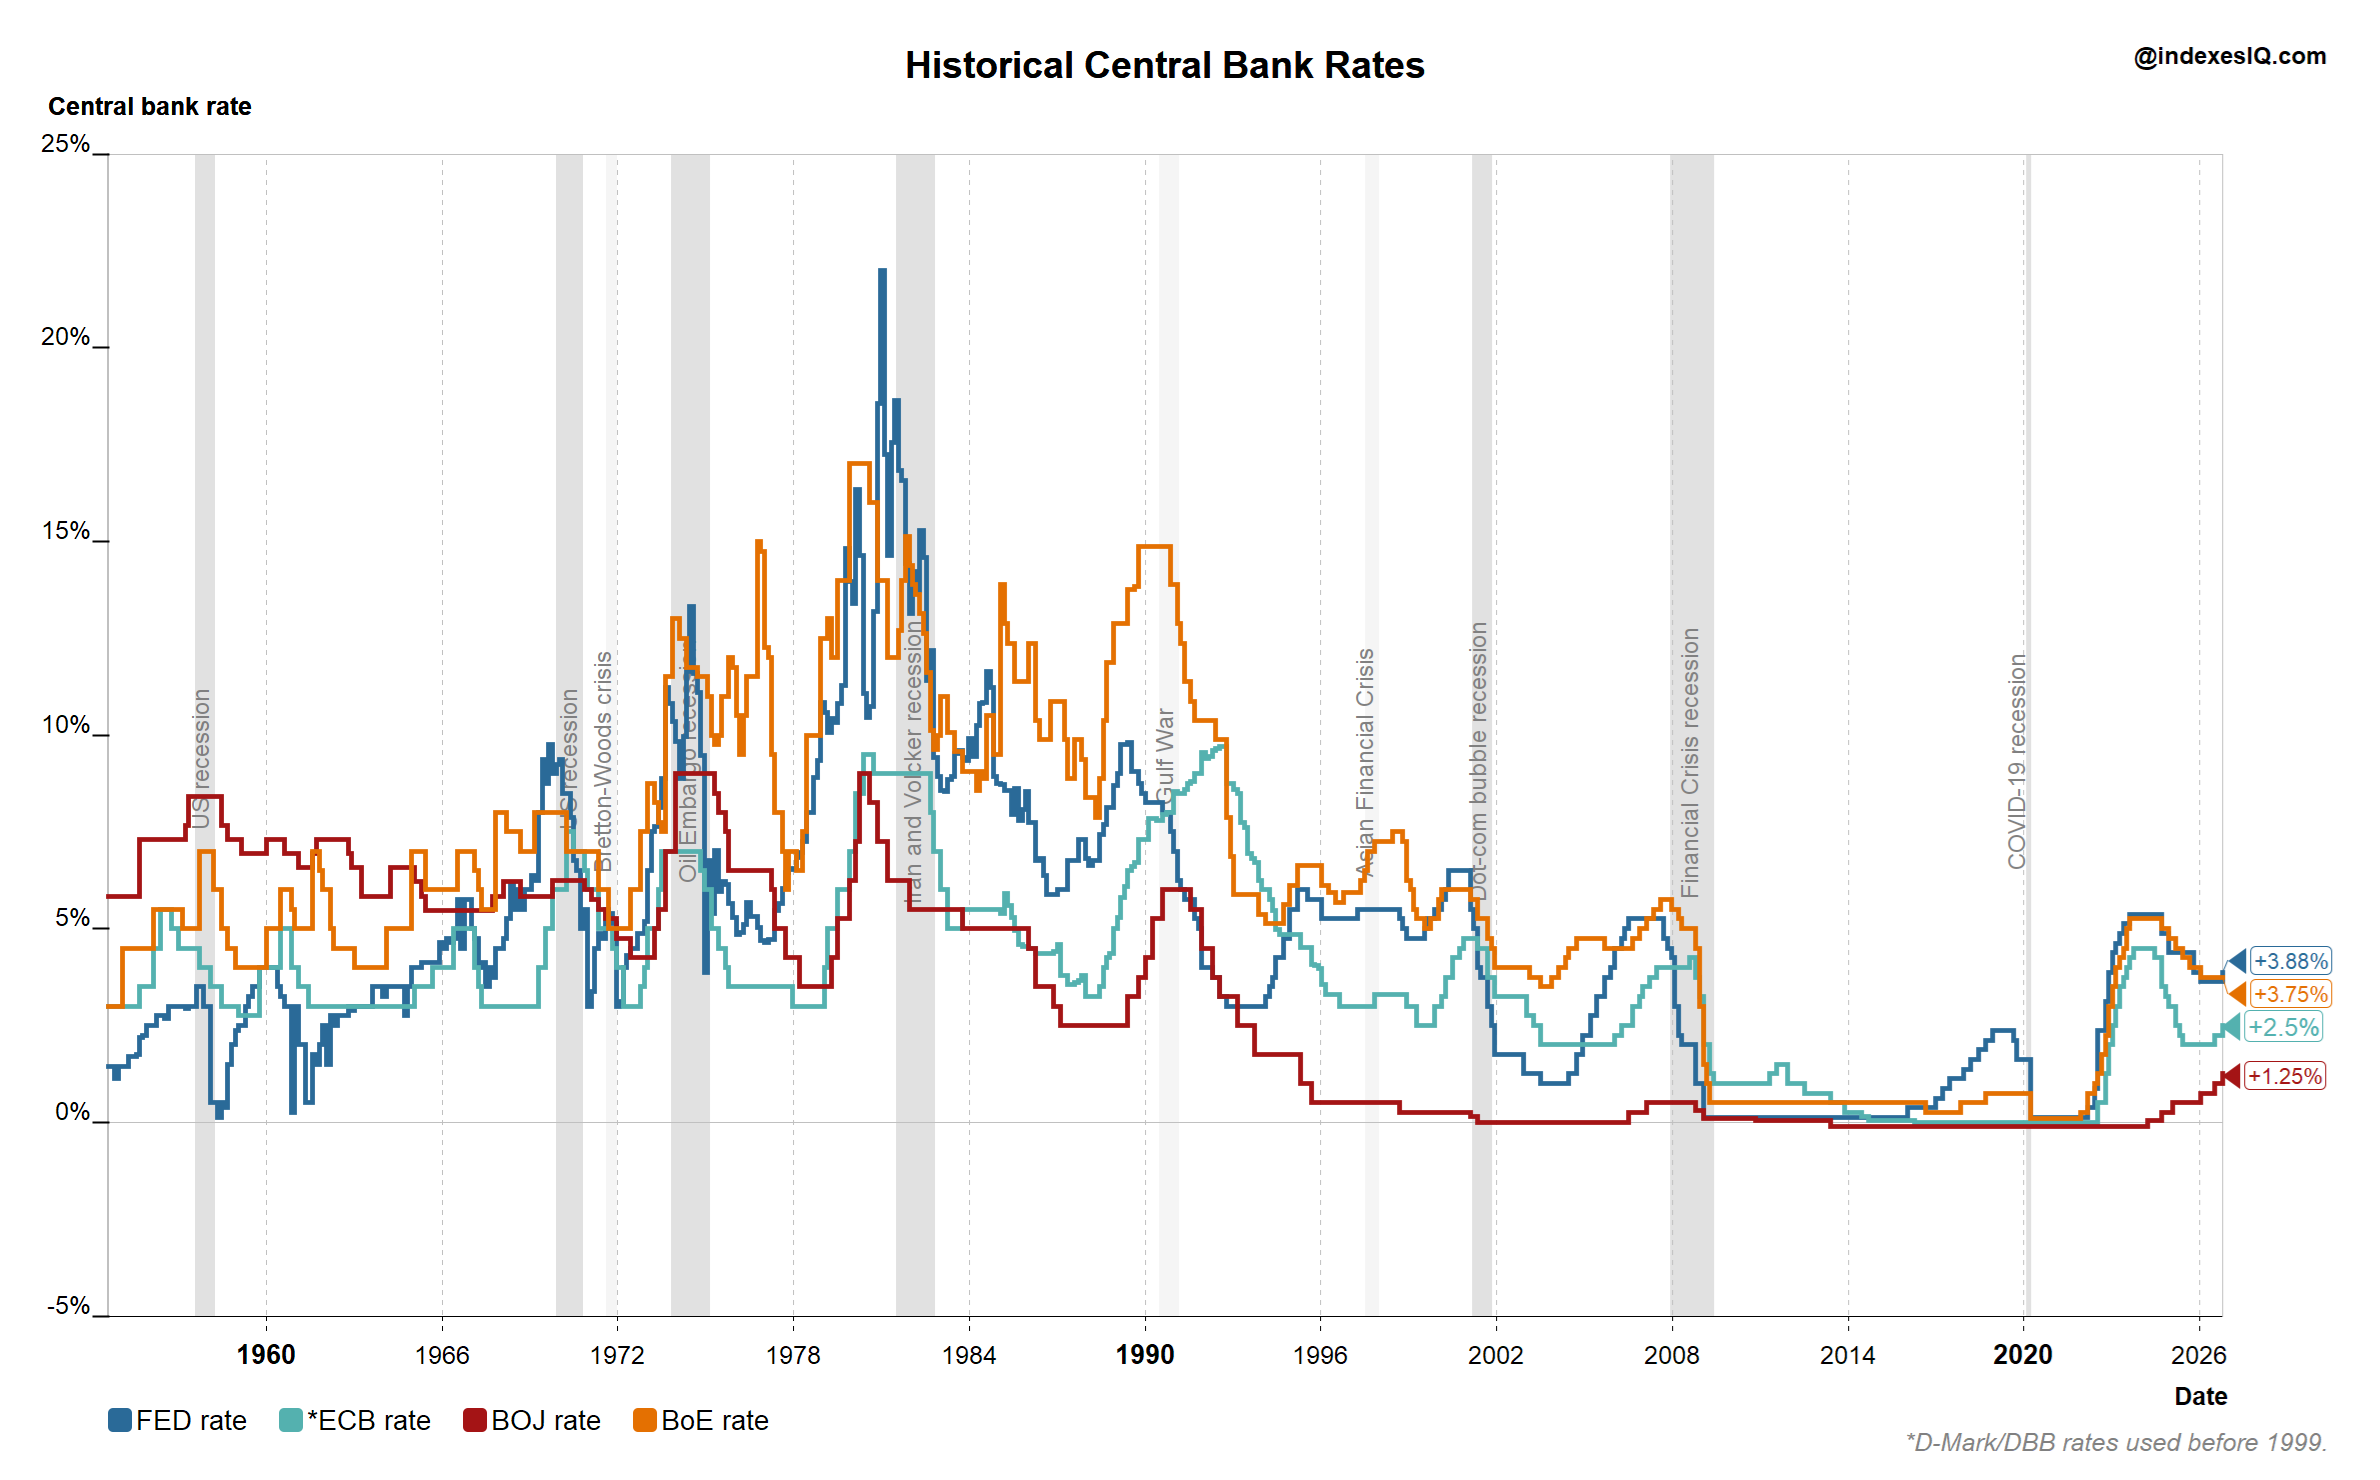
In September, four of the world's most closely watched central banks raised rates while Brazil cut. Are central banks still walking the old growth-vs-inflation tightrope — or is there a new one, pitting inflation against the fiscal cost of servicing record government debt?
Read insight →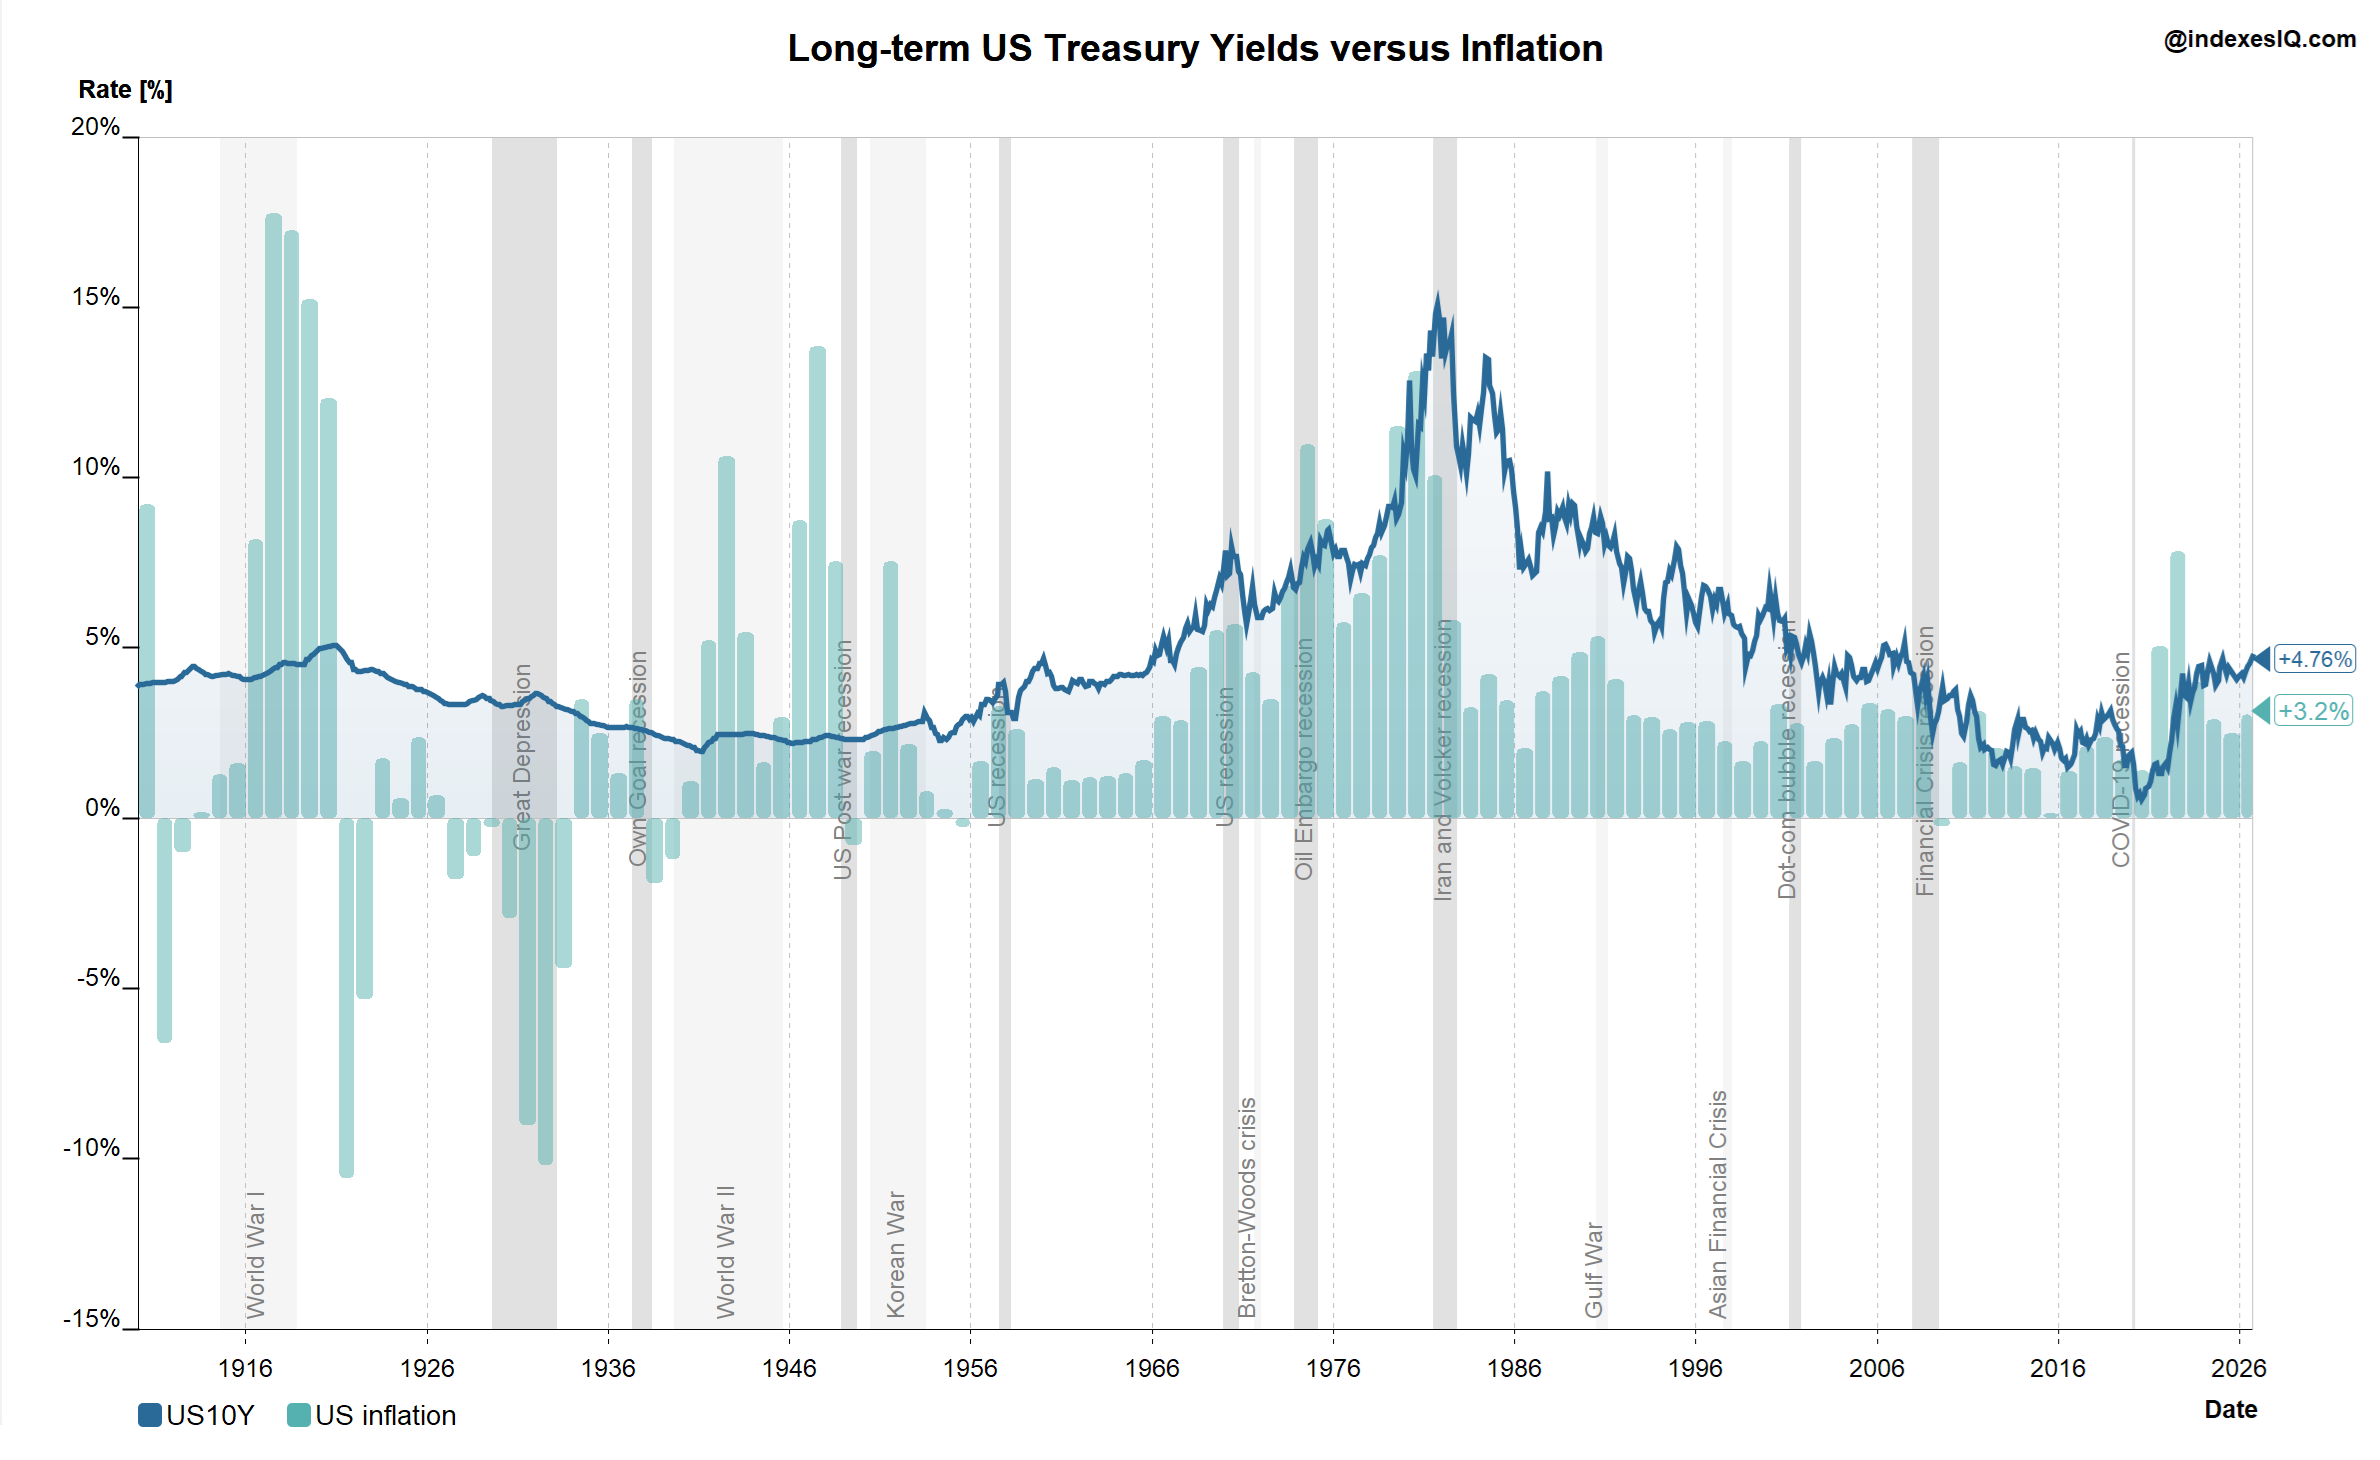
Quo Vadis, Treasuries?
The four-decade tide of falling US Treasury yields is over. Ferguson's Law was crossed by the US in 2024. The AI debt deluge is competing with Treasuries for investor capital — and Japan and China are quietly reducing their holdings. Where yields go from here is the defining fixed income question of our era.
Read insight →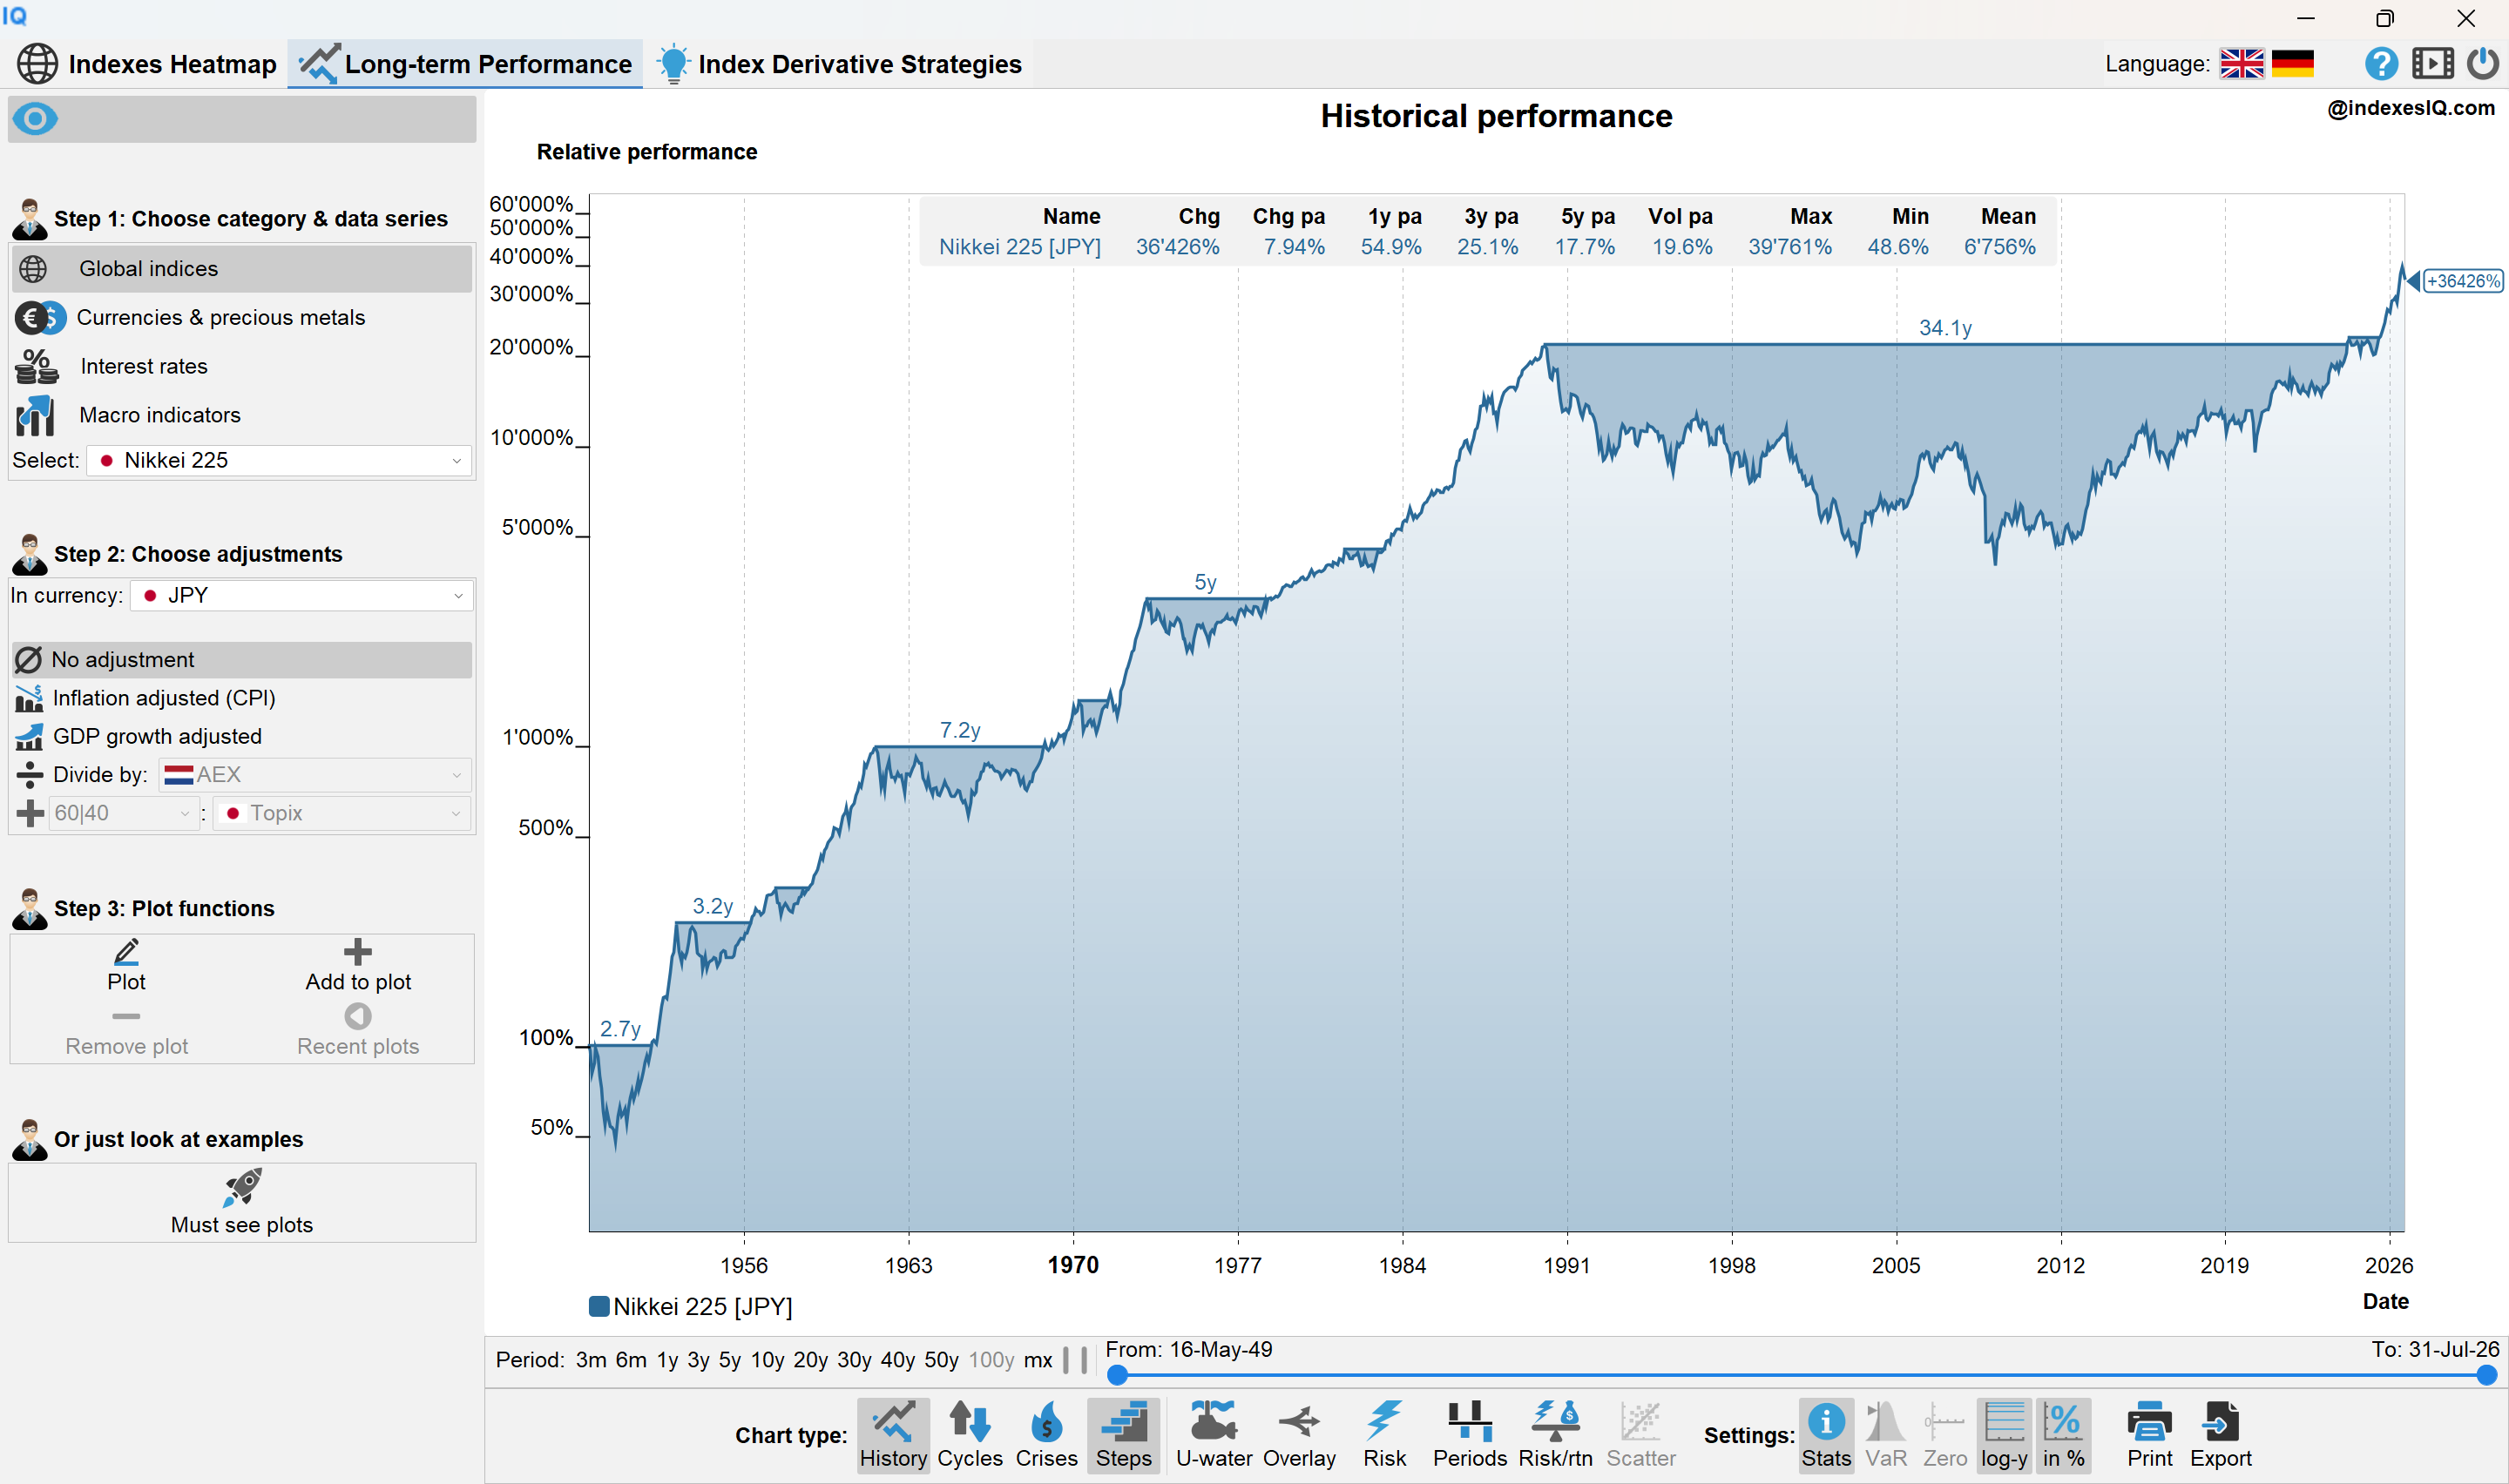
Big in Japan, Again?
After a 34-year recovery from the 1989 bubble, is Japan back as an economy and investment universe? The Nikkei is up ~8% per year since 1949 in JPY and +25% annually over the last three years — but for international investors, yen weakness tells a very different story. Down ~44% in real USD and ~48% in real EUR from the bubble peak.
Read insight →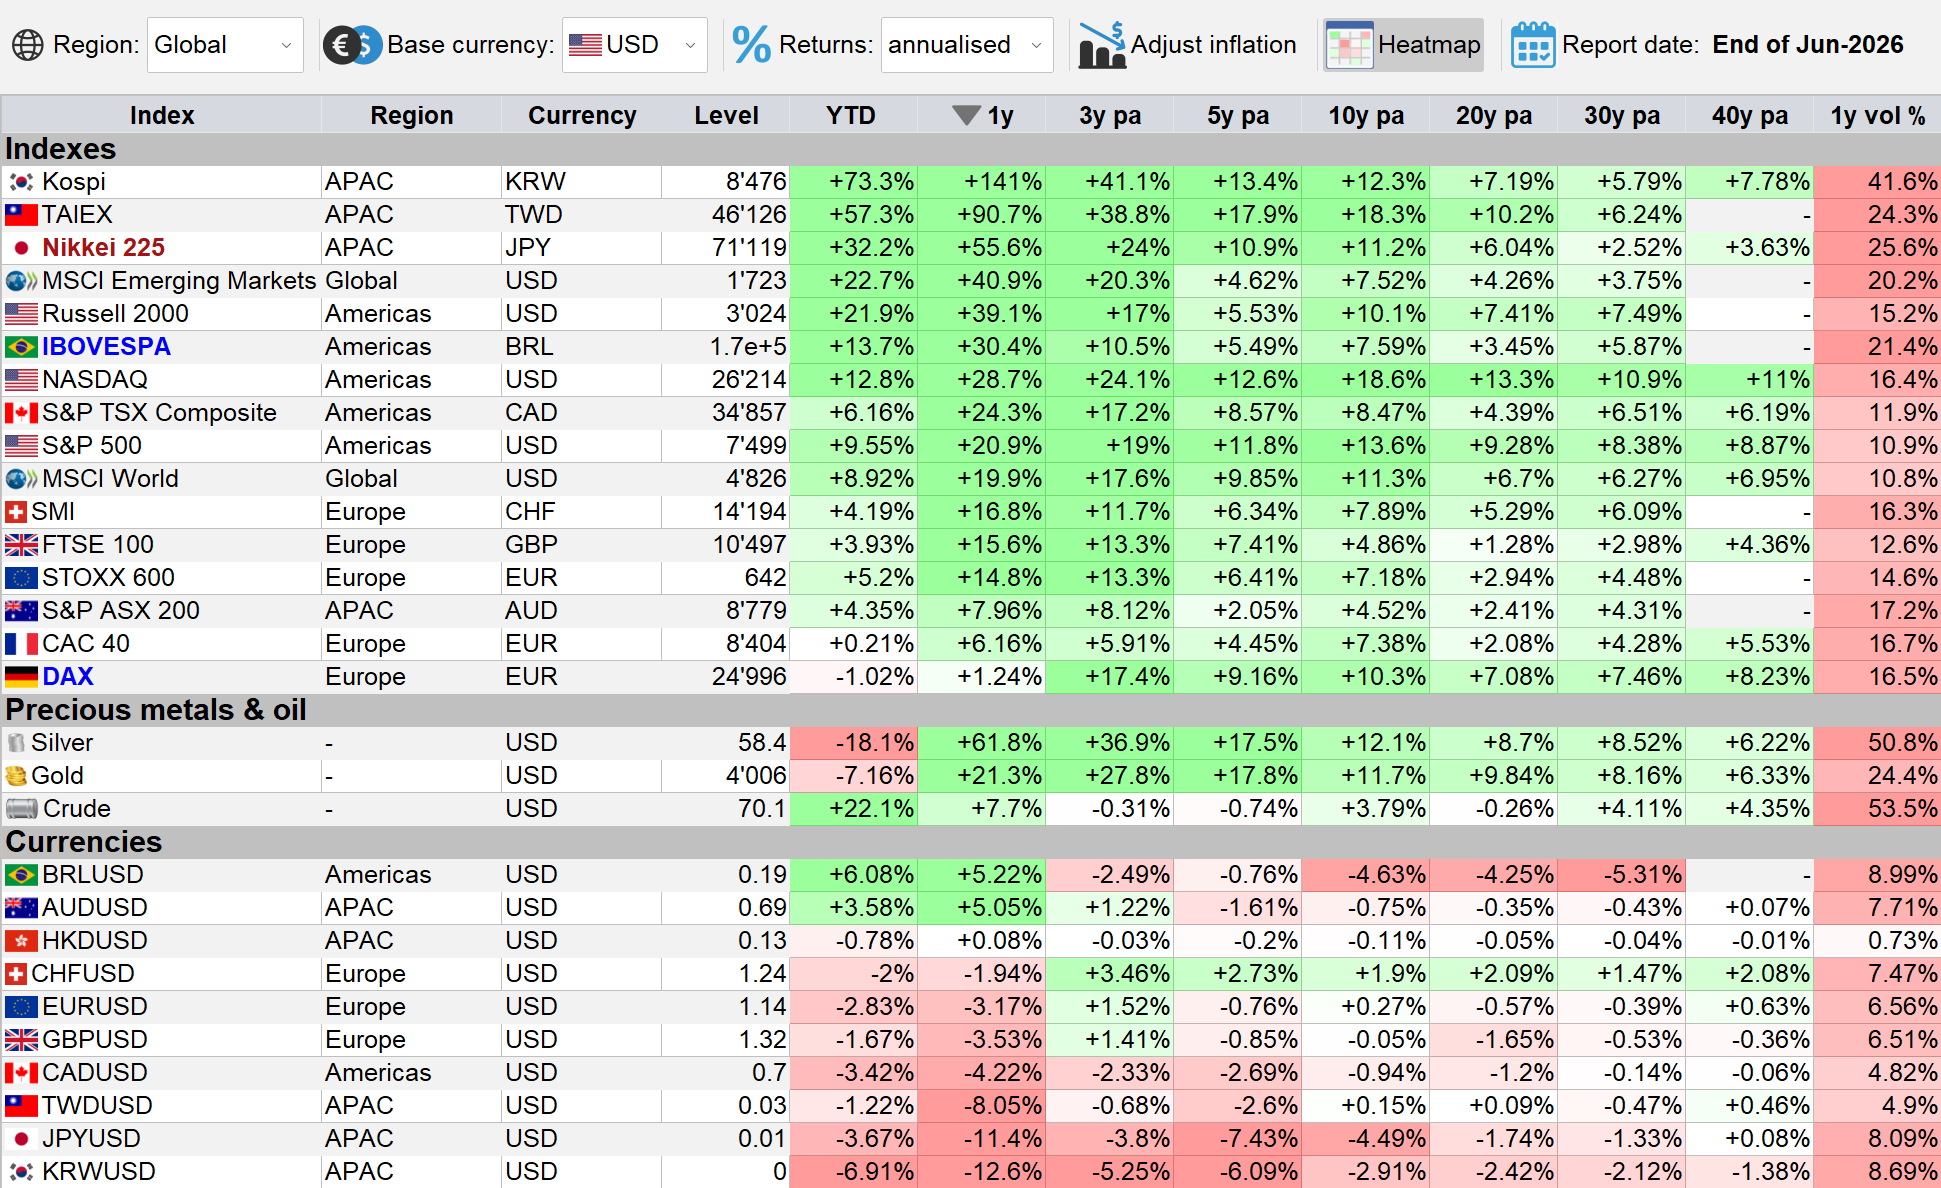
A World Divided — Global Equity Markets at a Historic Divergence
The IndexesIQ heatmap as of end of June 2026 tells a striking story. KOSPI at +141%, TAIEX at +91% — while the CAC 40 sits at +6% and the DAX at +1%. Emerging markets outperformed developed markets by a wide margin, the Russell 2000 beat the NASDAQ, and Brazil's Ibovespa surged +30% in USD terms.
Read insight →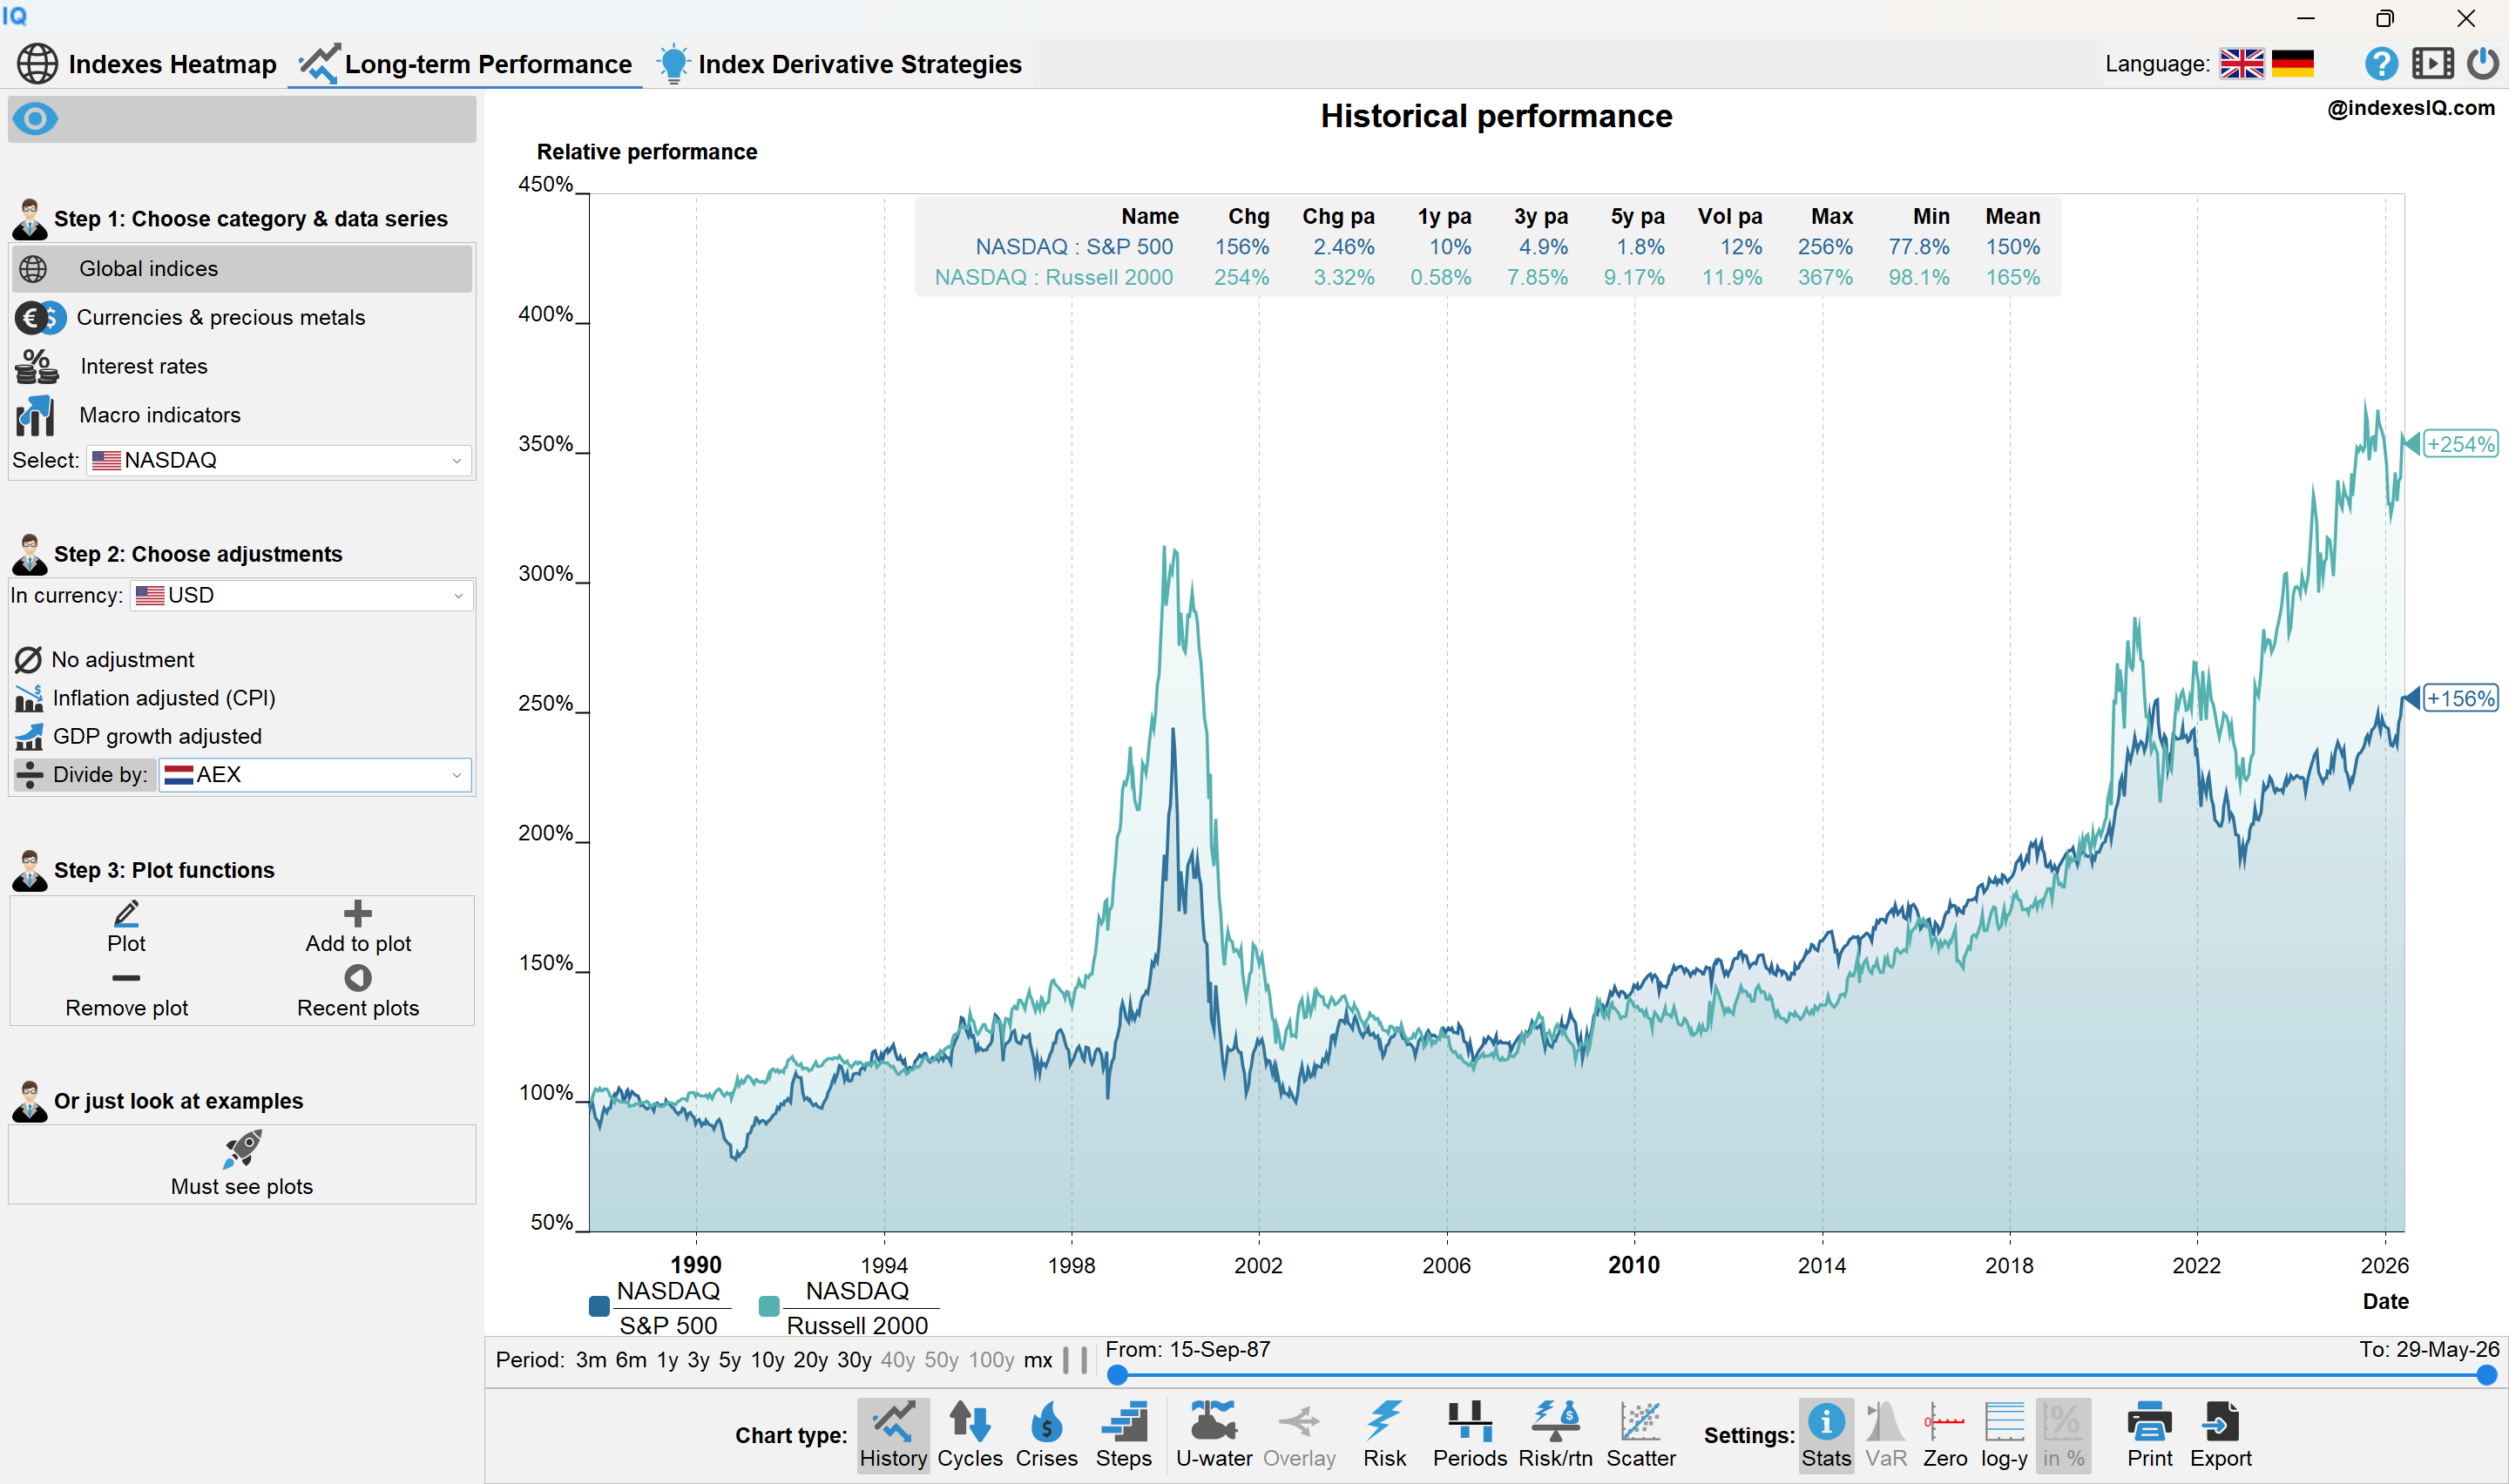
The AI Boom in Global Equity Markets
The rise of artificial intelligence has left measurable fingerprints across equity markets worldwide — but not equally. The magnitude of the impact depends heavily on each market's exposure to the AI semiconductor supply chain. What drove the AI boom, and is the AI-driven rally sustainable?
Read insight →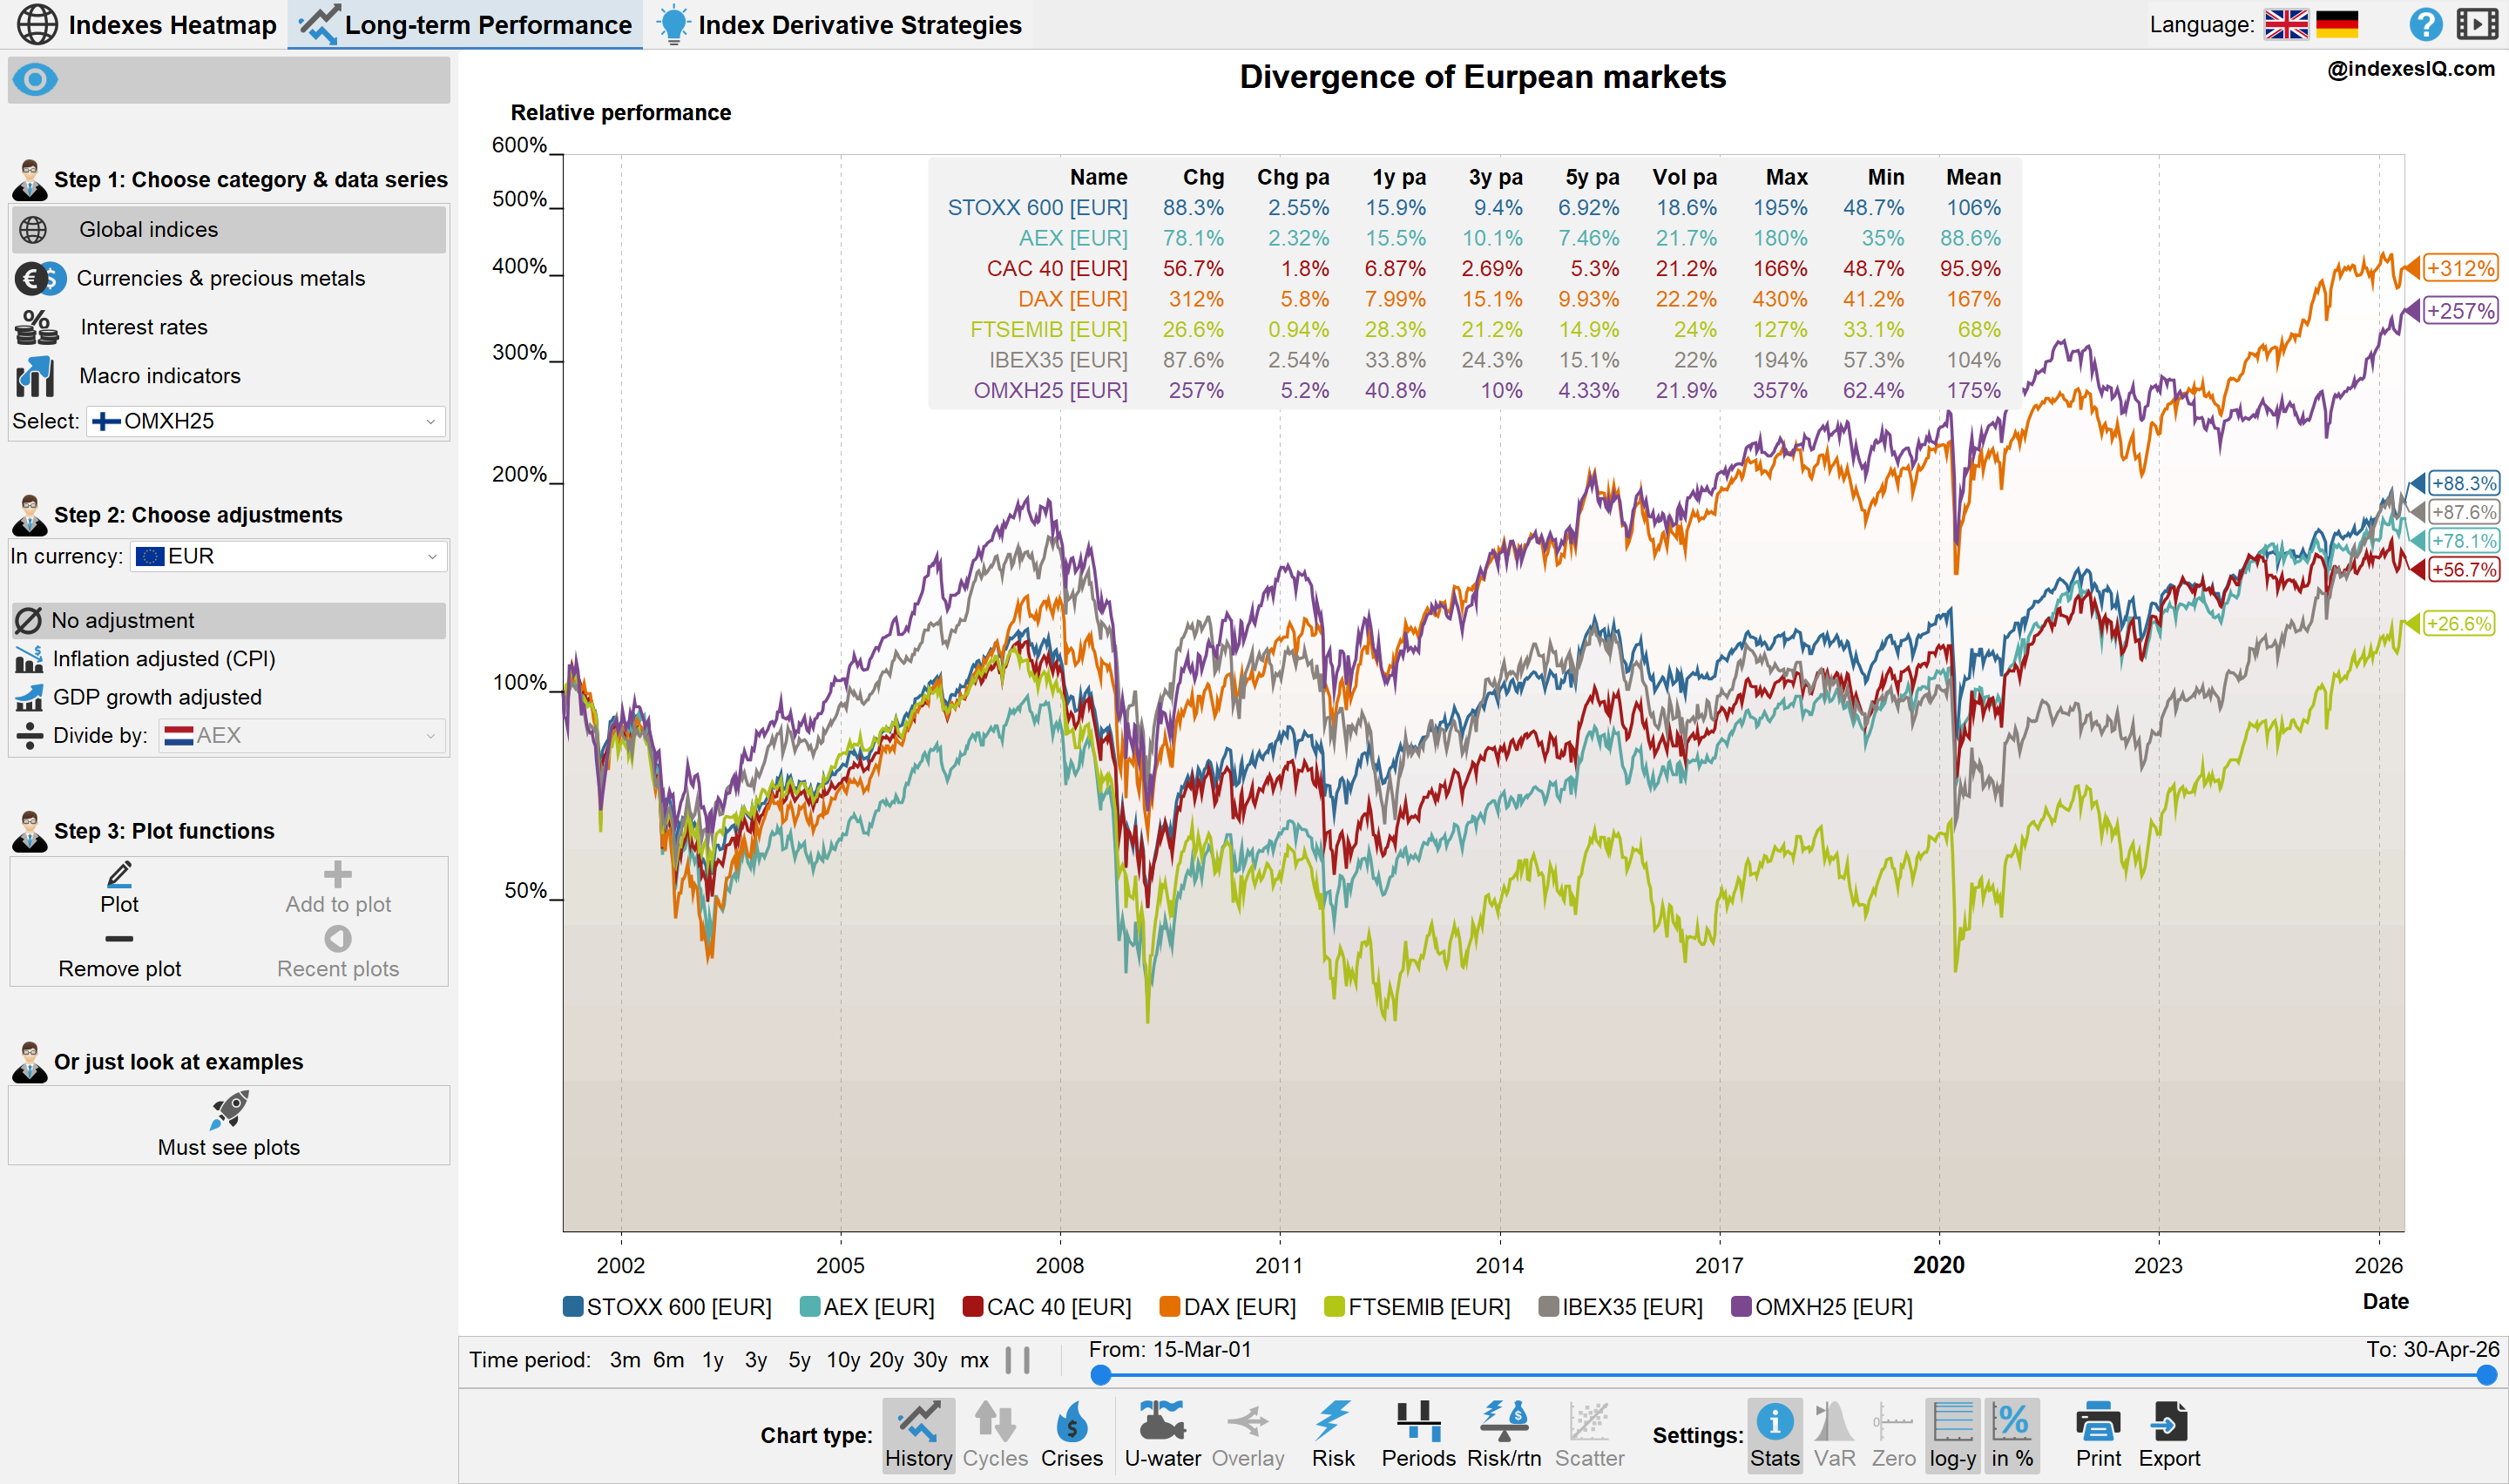
The Divergence of European Equity Markets — One Currency, Very Different Returns
Despite sharing the euro, European equity markets have diverged dramatically since 2001. Germany's DAX leads while Italy's FTSEMIB lags — but the DAX's total return methodology distorts the comparison. What does this mean for investors choosing between country and continental exposure?
Read insight →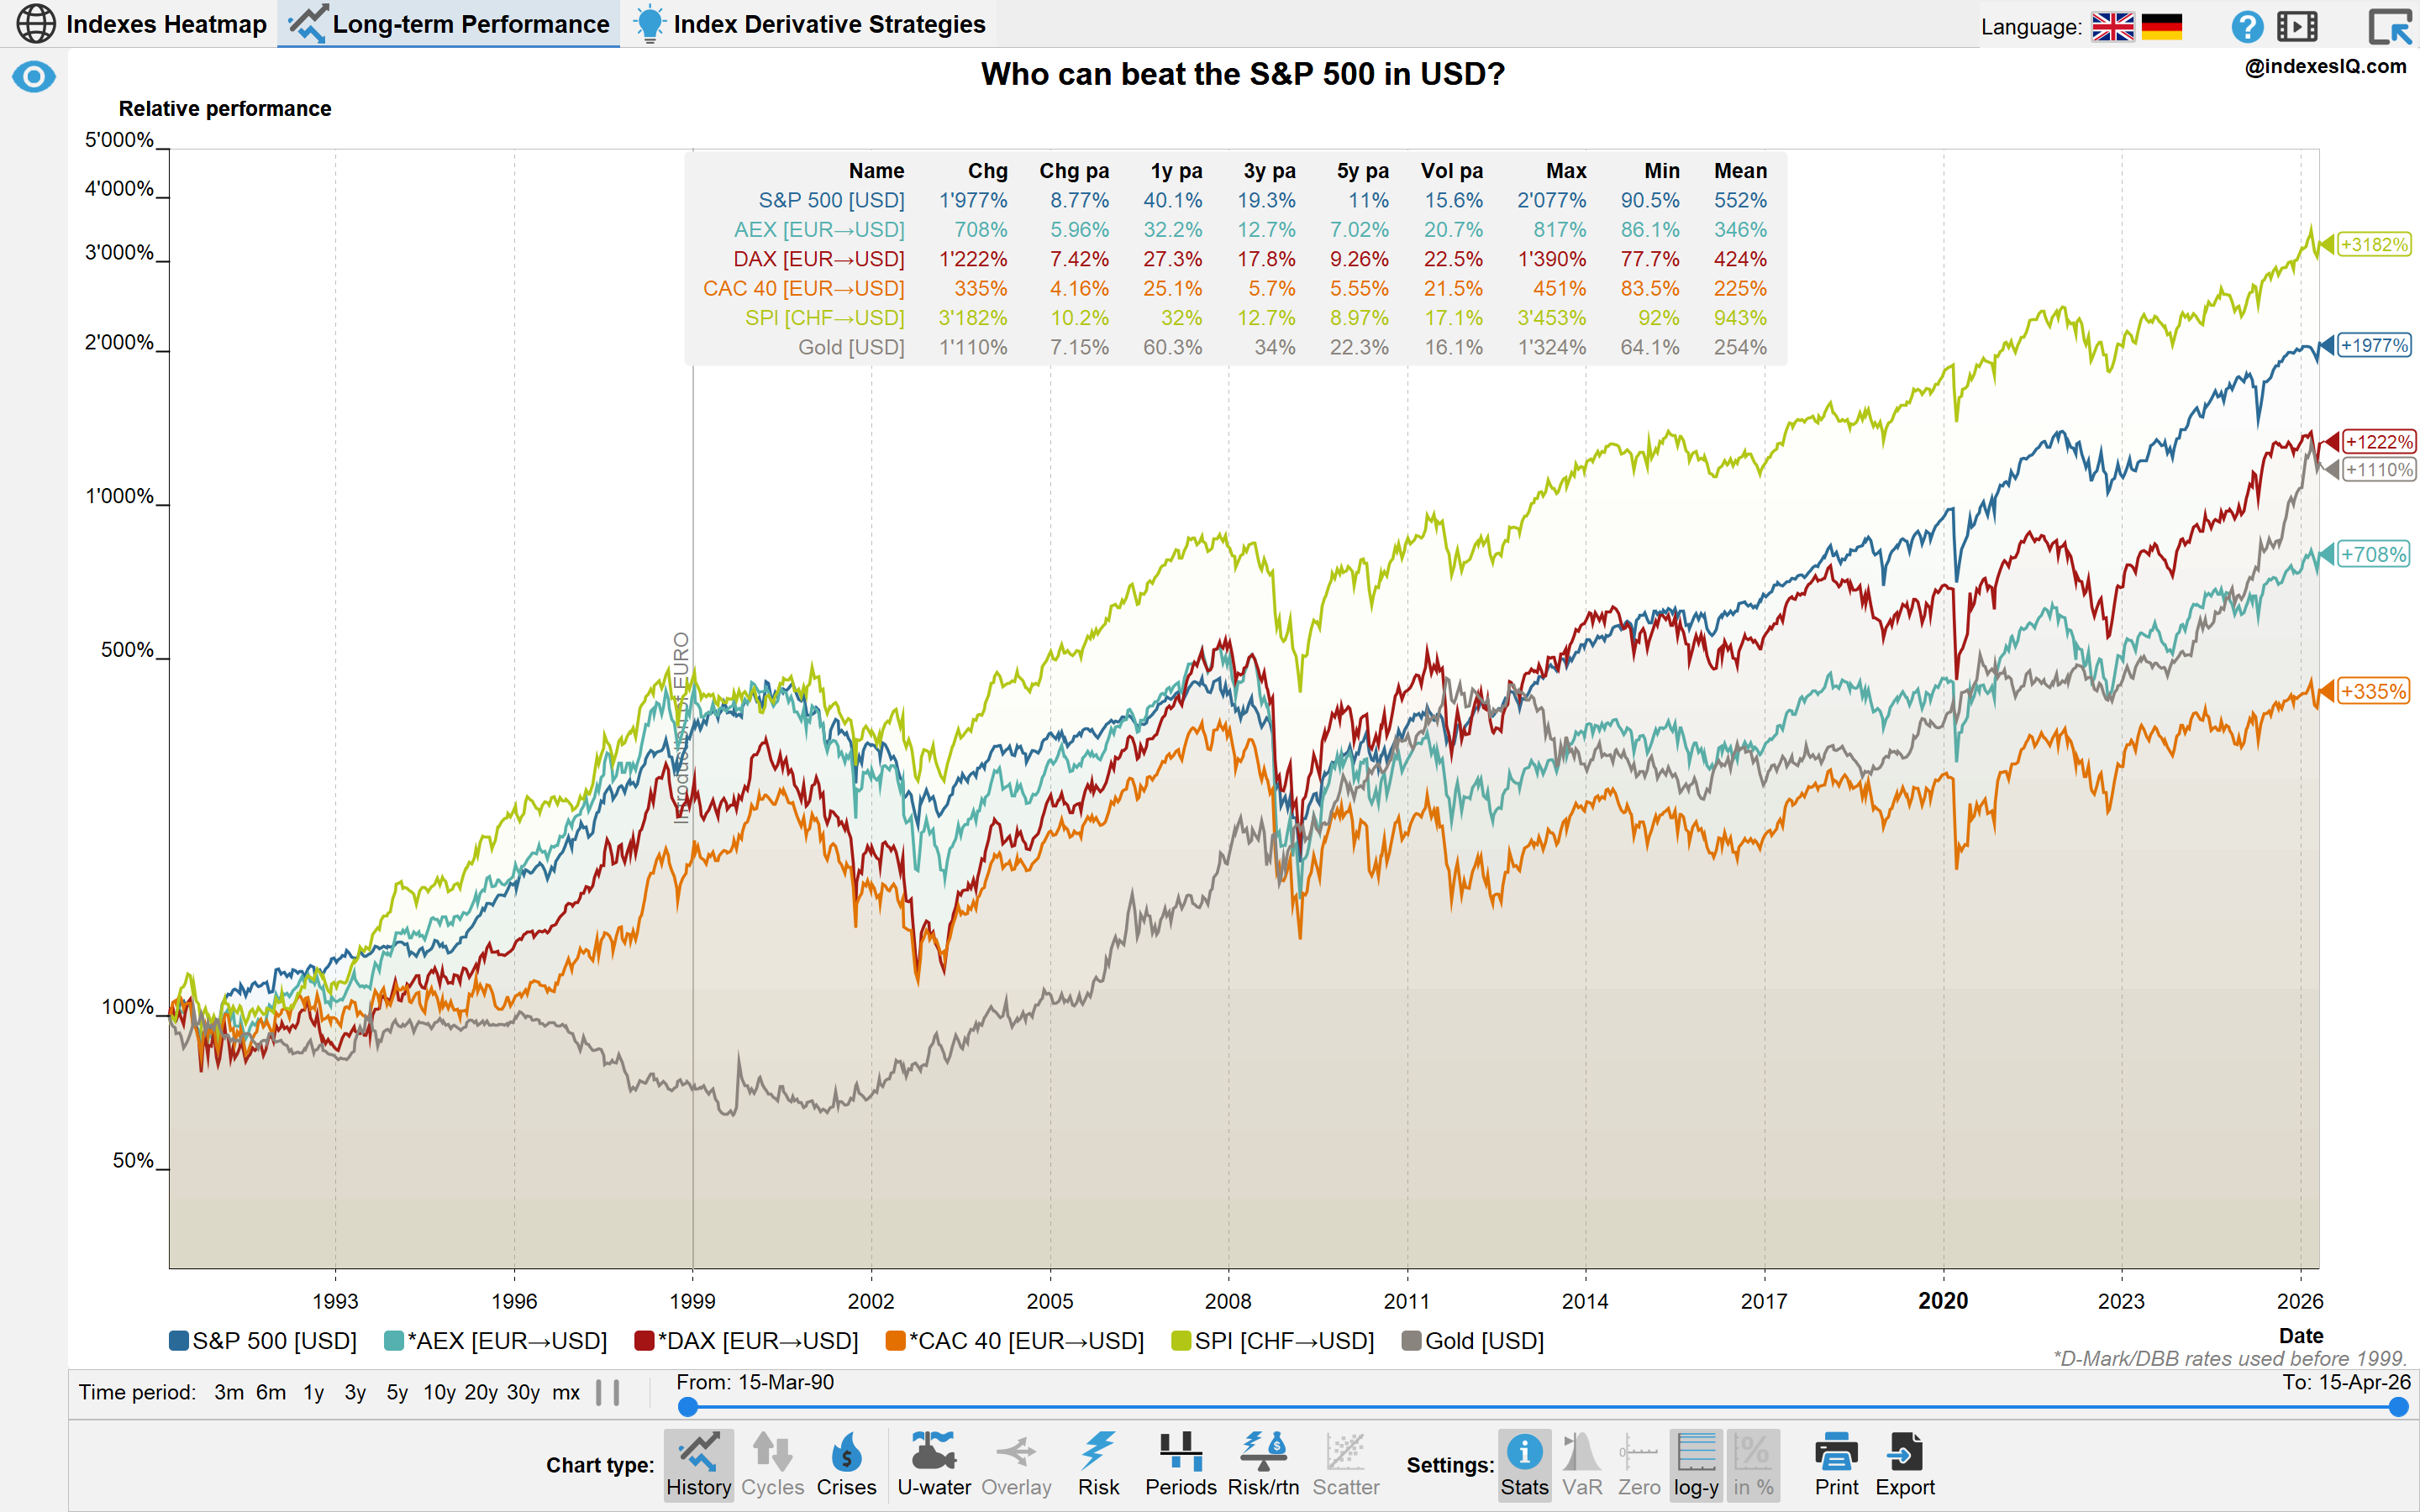
Comparing Indexes Fairly — Currency and Dividend Treatment Both Matter
The Swiss SPI appears to outperform the S&P 500 in USD terms since 1990 — but two hidden factors explain it: a 90% franc appreciation and the SPI's total return methodology. Always align both currency and dividend treatment before comparing markets.
Read insight →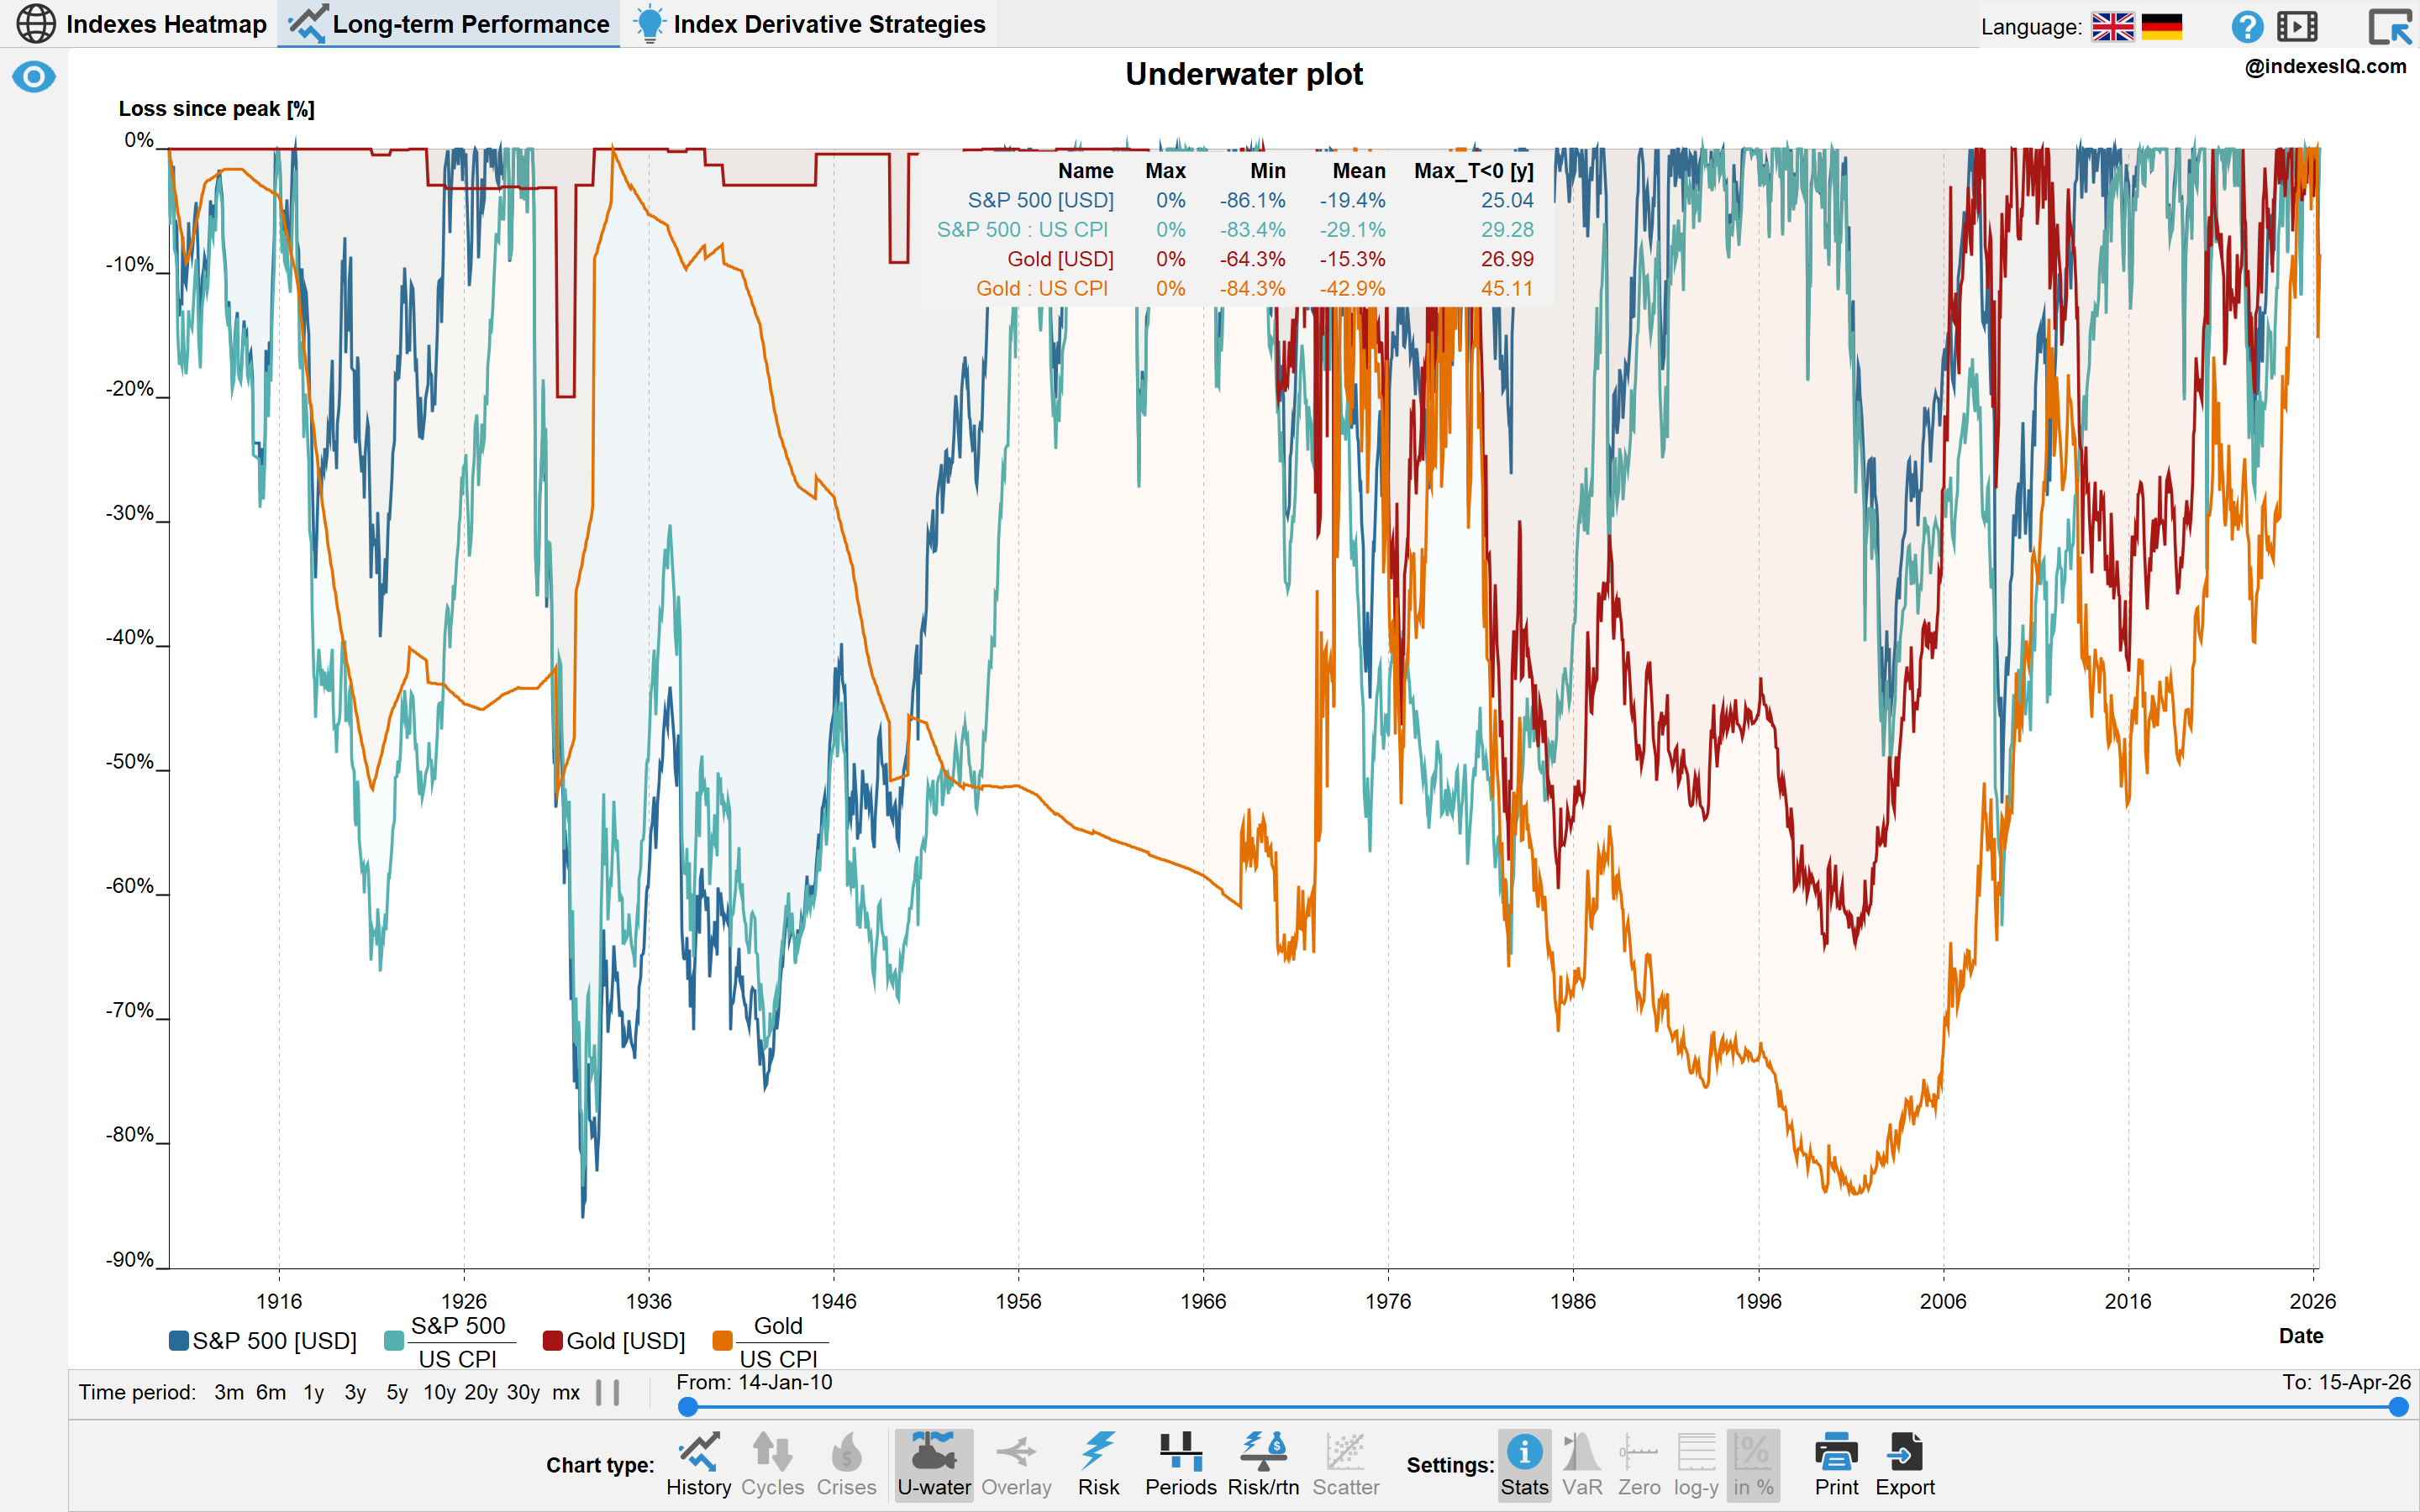
Long-Term Investment Risk Is Not About Volatility — It's About Time to Recover
The S&P 500 took 25 years to recover from the 1929 crash. Gold buyers in 1980 waited 45 years in real terms to break even. Drawdown recovery time — not volatility — is the risk that matters most for long-term investors.
Read insight →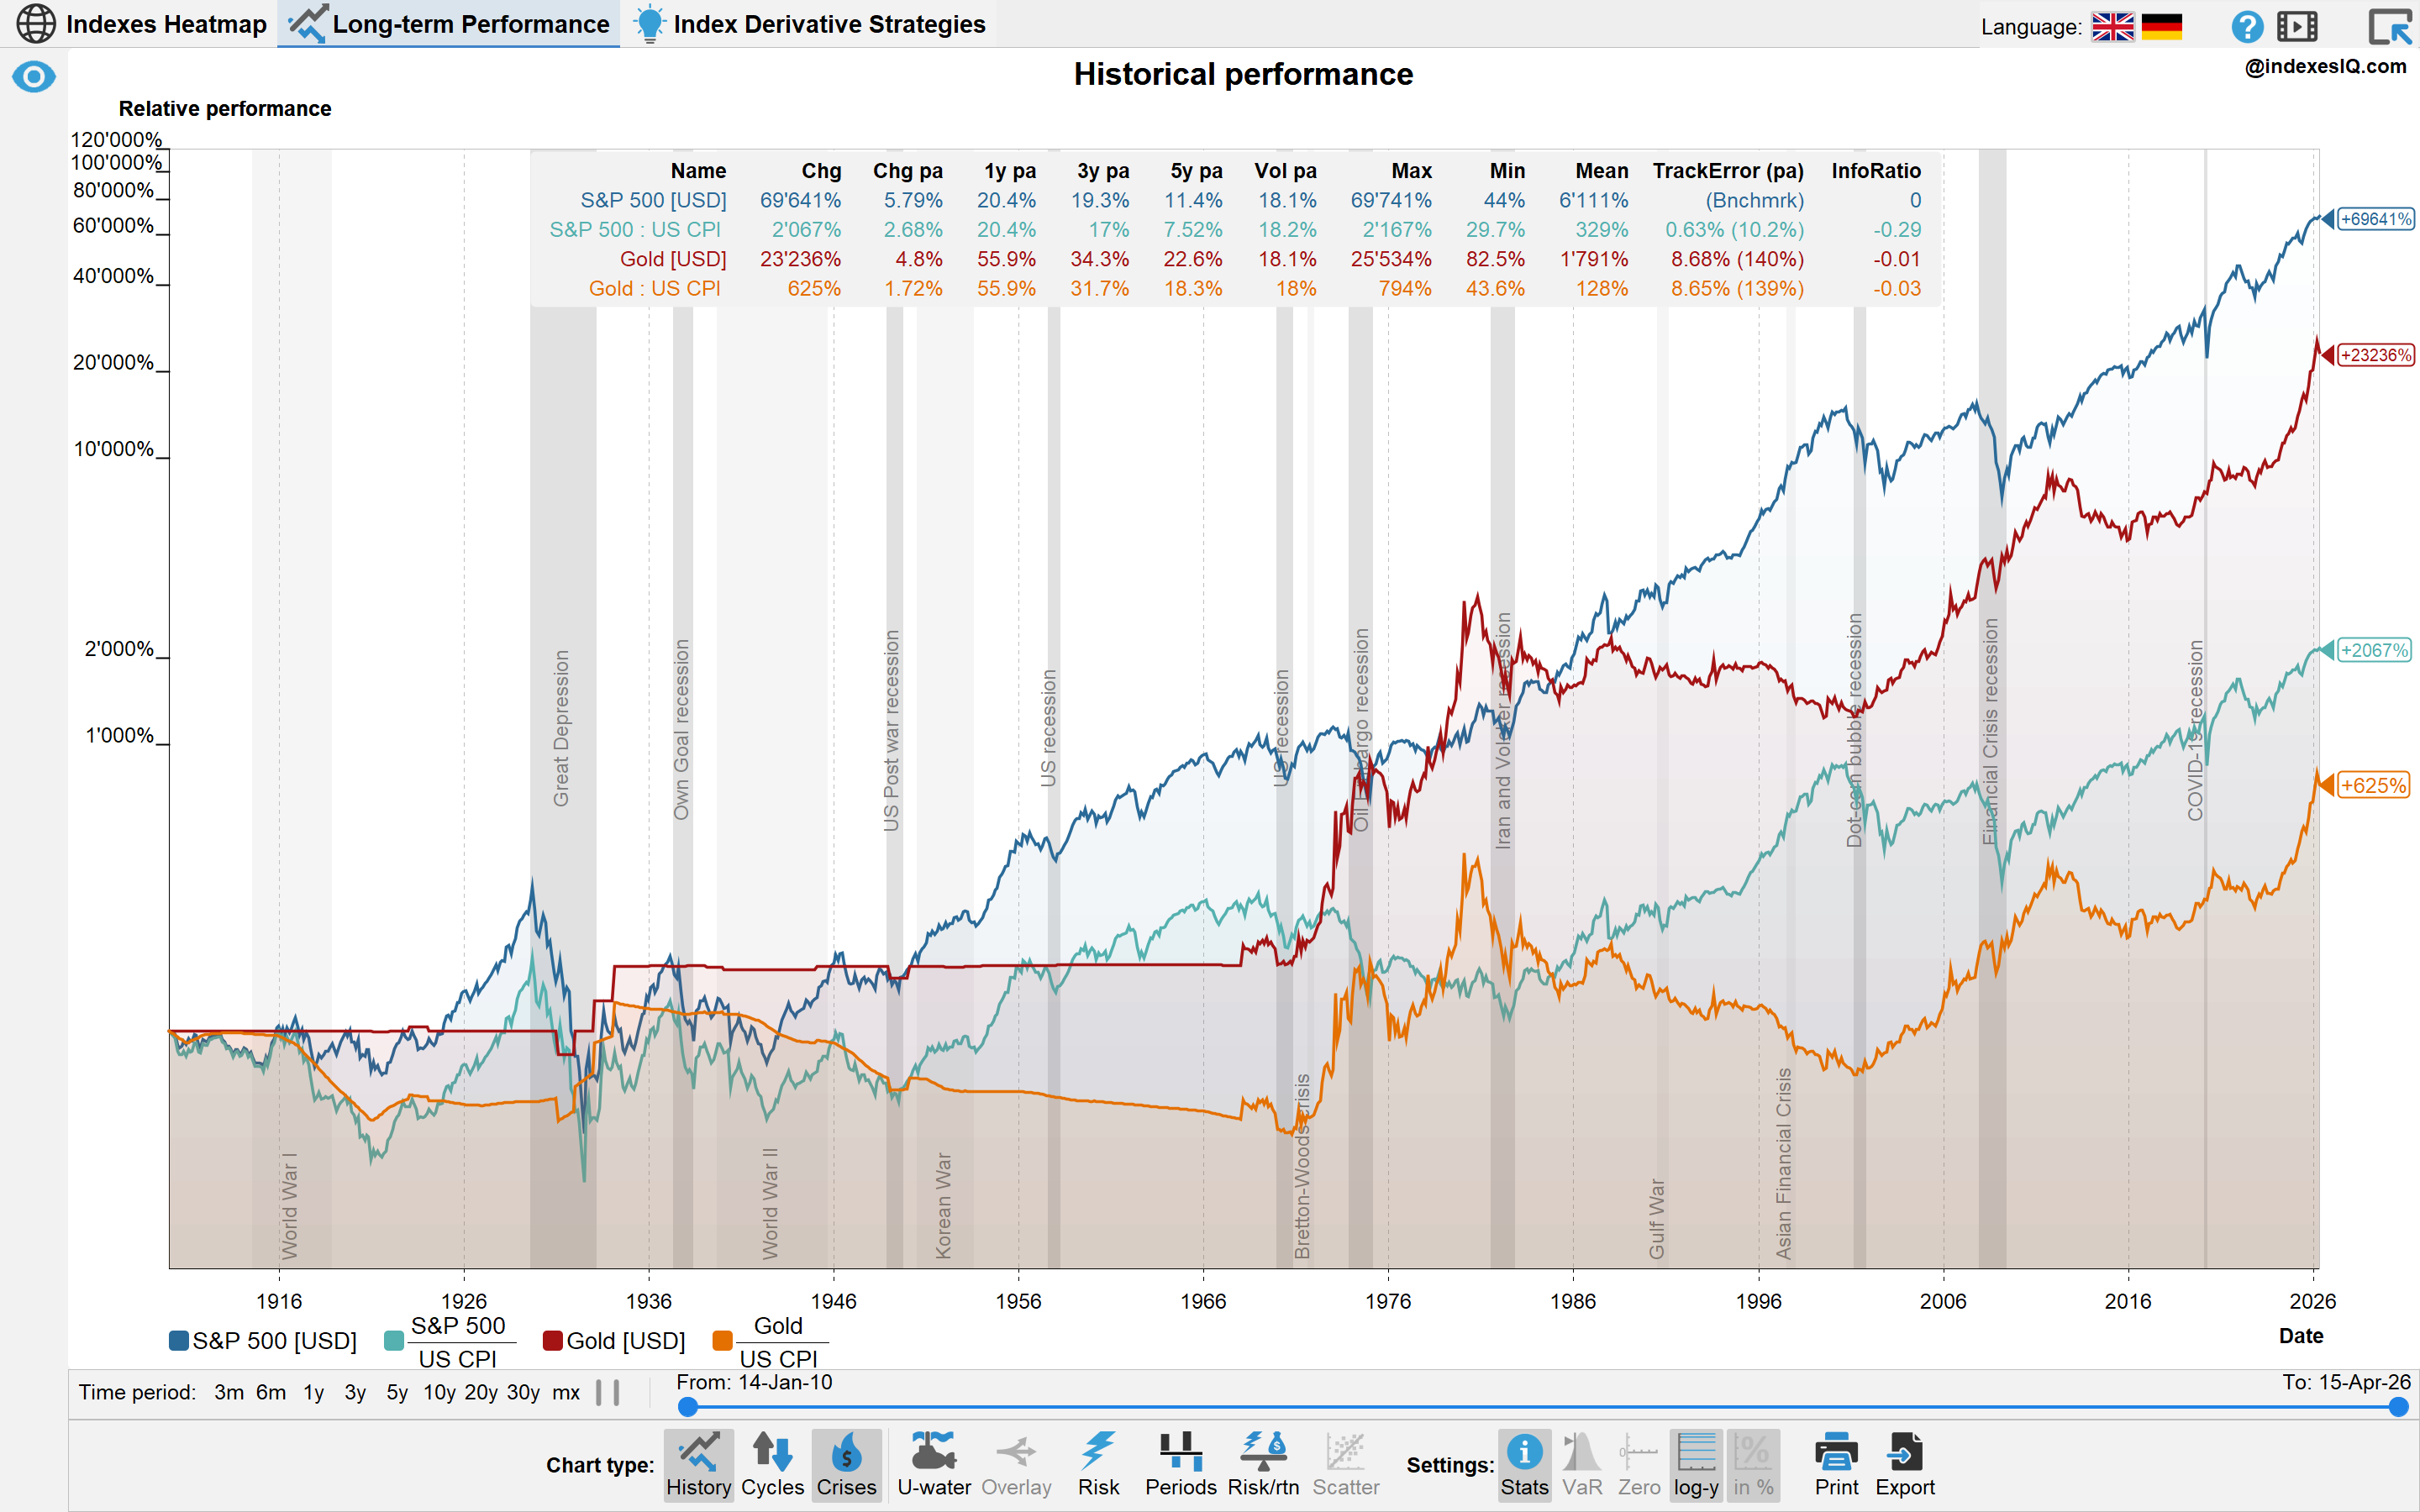
The Role of Inflation in Long-Term Investing
The S&P 500 returned +64,731% in nominal terms since 1910. In real terms, after inflation, that falls to +1,915%. Dividends — excluded from price-only indexes — add substantially more. Never judge an investment by its nominal return alone.
Read insight →