
Comparing Indexes Fairly — Currency and Dividend Treatment Both Matter
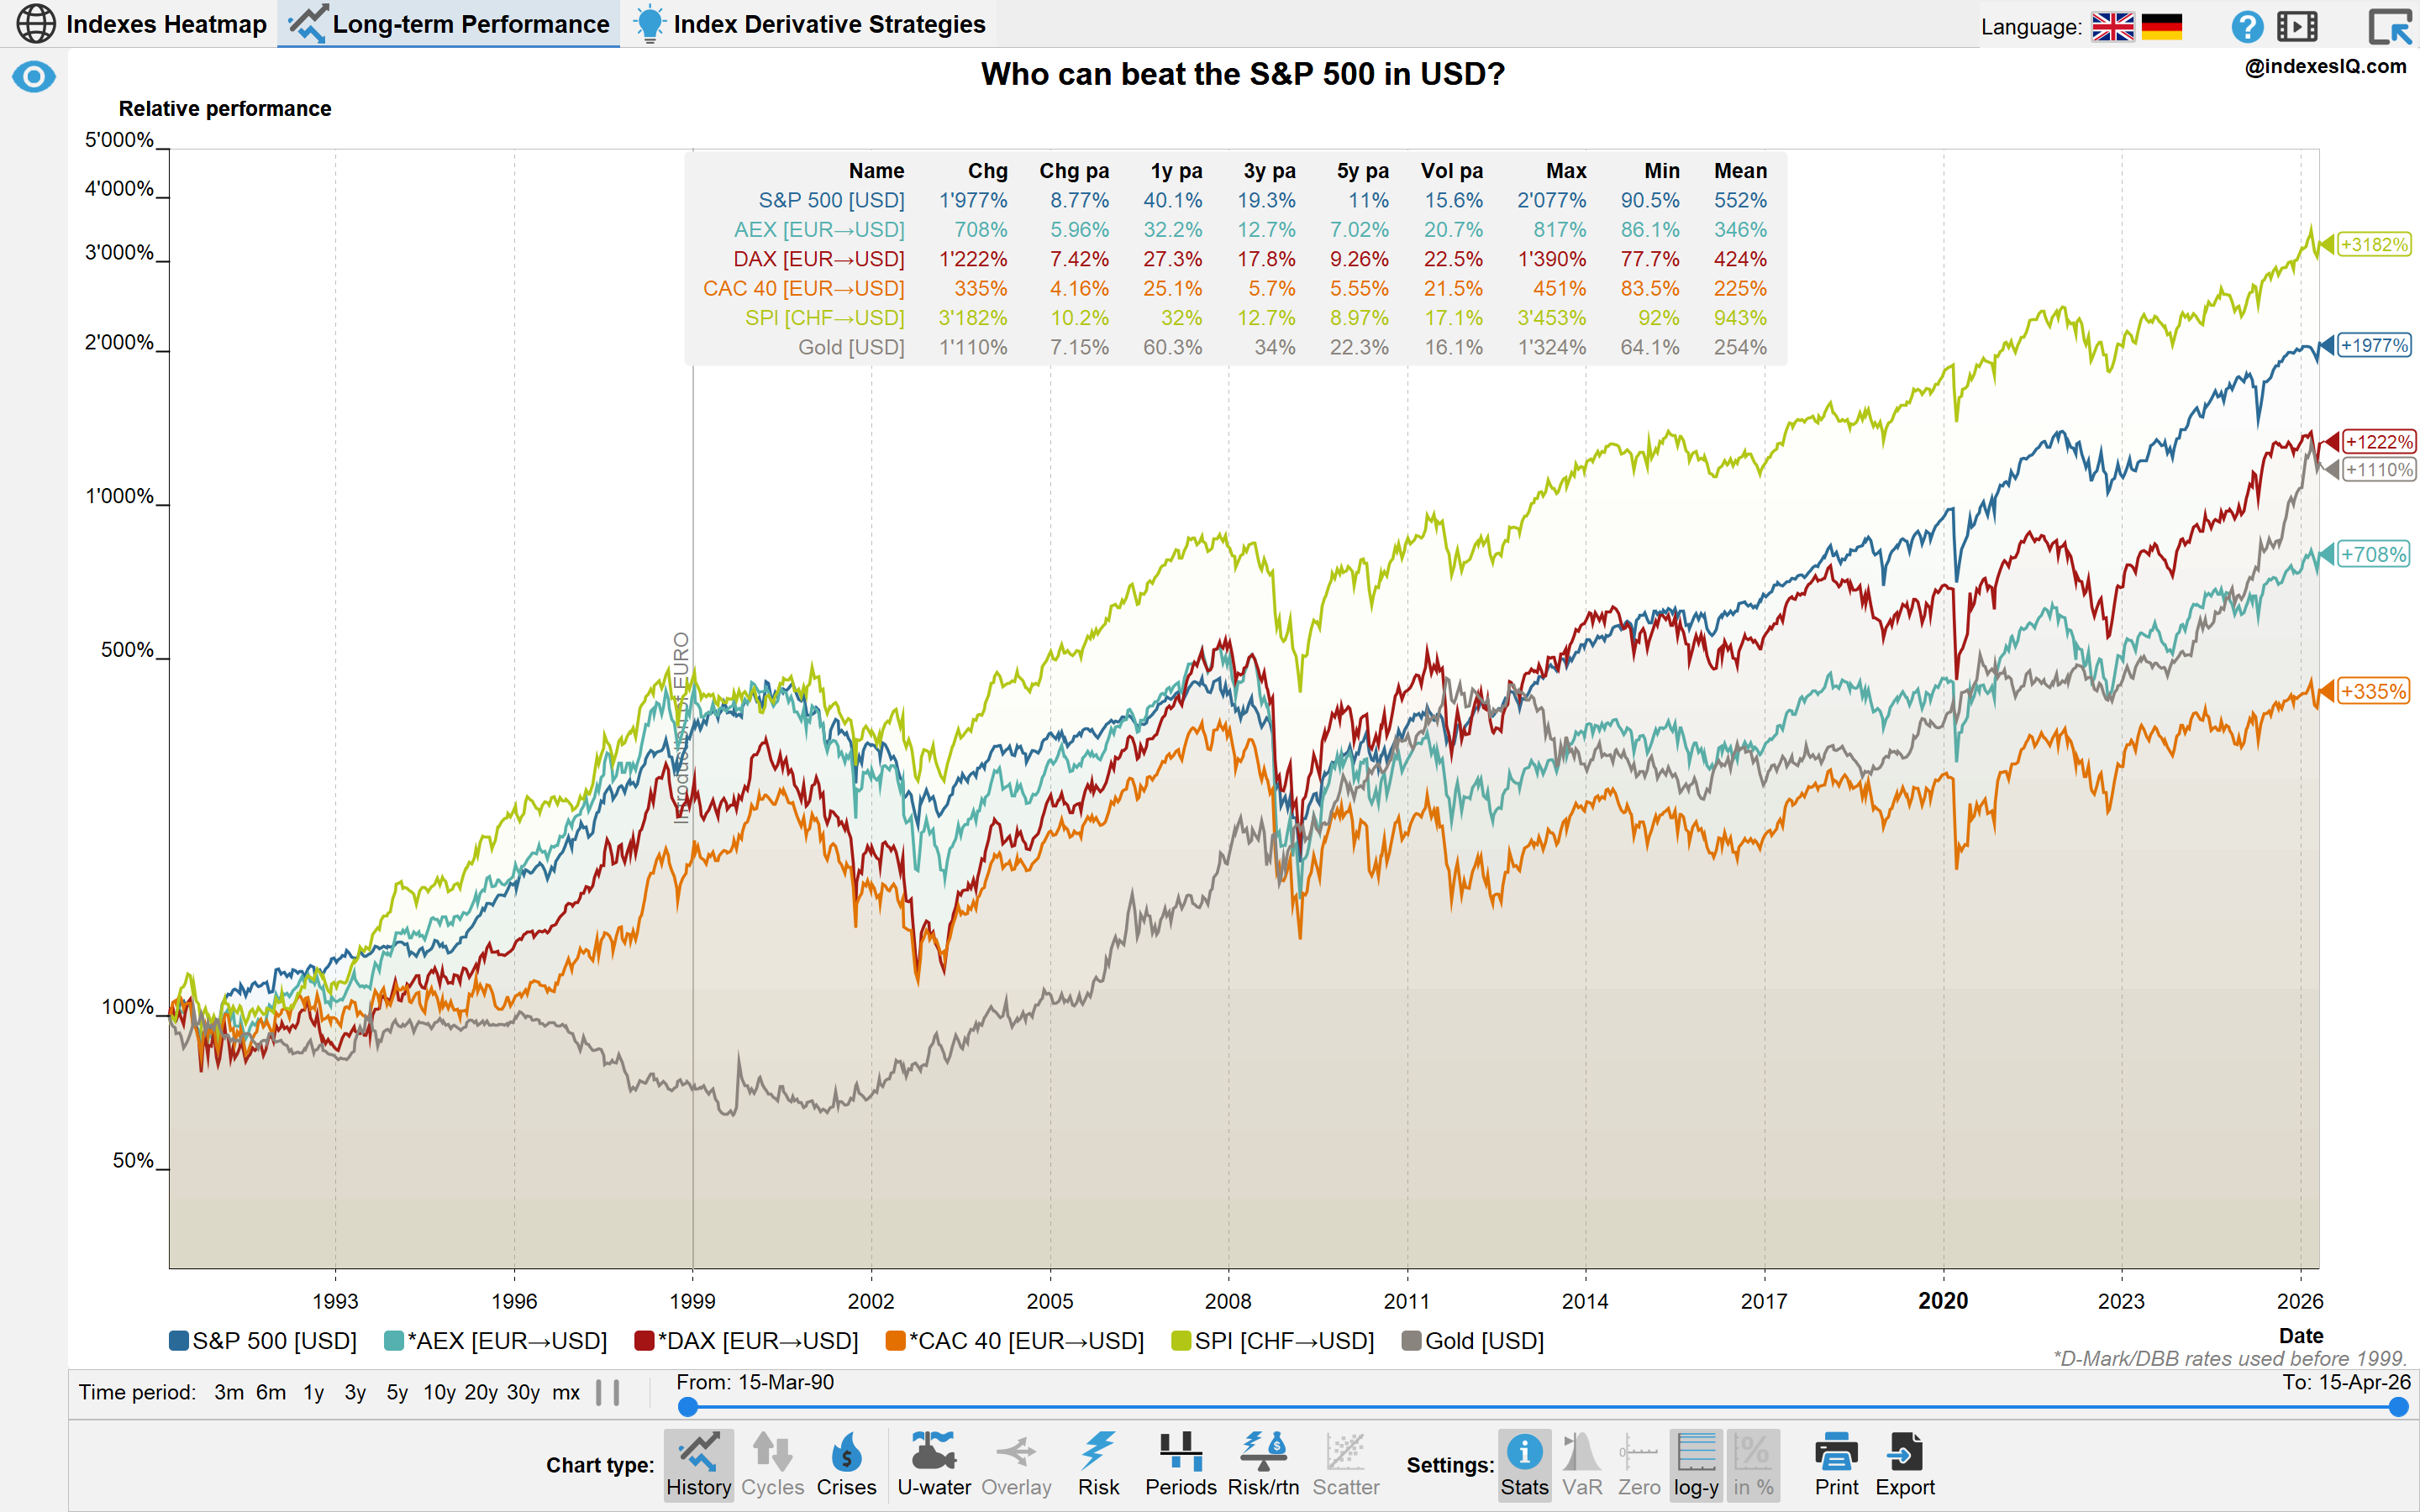
S&P 500 vs Swiss SPI and selected European indexes in USD terms, 1990 to end of March 2026. Source: IndexesIQ.
A USD-based investor comparing the S&P 500 to the Swiss Performance Index (SPI) since 1990 might conclude that Switzerland outperformed the United States. That conclusion would be wrong — or at least deeply misleading. Two methodological factors explain almost the entire apparent gap, and neither of them has anything to do with the underlying performance of Swiss versus American companies.
Factor 1 — The Swiss Franc Appreciated ~90% Against the Dollar
The Swiss franc has been one of the strongest major currencies in the world over the past three and a half decades. Since 1990, it has appreciated by approximately 90% against the US dollar — a consequence of Switzerland's exceptional monetary stability, persistent current account surpluses and its status as a safe-haven currency during global crises.
When a USD-based investor looks at the SPI in dollar terms, they are seeing a combination of two things: the performance of Swiss equities in Swiss francs, and the appreciation of the franc against the dollar. The franc component alone added roughly 90 percentage points to the USD return over the period. This is not equity alpha — it is currency translation.
The currency adjustment function in the IndexesIQ app allows you to strip this out instantly — switching the SPI from USD to local CHF terms removes the currency effect and shows the pure equity return.
Factor 2 — The SPI Is a Total Return Index; the S&P 500 Price Index Is Not
The Swiss Performance Index is a total return index — it reinvests dividends. The standard S&P 500 is a price-only index — it excludes dividends entirely. Comparing them is methodologically equivalent to comparing a runner's time with and without the final kilometre. The S&P 500 Total Return index — which also reinvests dividends — tells a very different story.
Dividends have historically contributed roughly 40% of the total long-term real return of US equities. Excluding them from one side of a comparison while including them on the other systematically understates US performance relative to markets whose flagship indexes happen to be total return.
This is the same issue at the heart of Insight #4, which examines the divergence of European equity markets in detail — and specifically why the DAX's total return methodology makes it look stronger than comparable price-only European indexes over the same period.
The Rule: Always Align Both Dimensions Before Comparing
Any fair cross-market comparison requires alignment on two axes:
1. Currency: Either convert all indexes to a common currency (typically USD or EUR for international comparisons) or compare all indexes in their local currency. Mixing local-currency and foreign-currency returns in the same chart produces a comparison that is partly about equities and partly about exchange rates.
2. Dividend treatment: Either use total return indexes for all markets, or price-only indexes for all markets. The Index Academy lists the methodology for each major index — which ones are price-only (S&P 500, Nikkei 225, CAC 40, Hang Seng) and which are total return (DAX, SPI, MSCI indexes).
The IndexesIQ app handles both adjustments in the Long-term Performance pane. The currency adjustment converts any index to any base currency using the full historical exchange rate series. For dividend treatment, both the S&P 500 and S&P 500 TR are available as separate series.
What the Corrected Comparison Shows
When you align both dimensions — converting the SPI to USD and comparing it to the S&P 500 TR rather than the price index — the apparent Swiss outperformance largely disappears. The US equity market, measured correctly, has been one of the strongest performing large markets in the world over the past 35 years. Much of the apparent outperformance of other markets in USD terms is currency translation and dividend methodology, not genuine equity alpha.
Never compare indexes across markets without first aligning currency and dividend treatment. The Swiss SPI's apparent outperformance of the S&P 500 in USD terms since 1990 is largely explained by a 90% franc appreciation and the SPI's total return methodology. On a like-for-like basis, using USD and total return for both, the picture looks very different. The same issue applies to the DAX vs other European indexes — covered in detail in Insight #4.