
Long-Term Investment Risk Is Not About Volatility — It's About Time to Recover
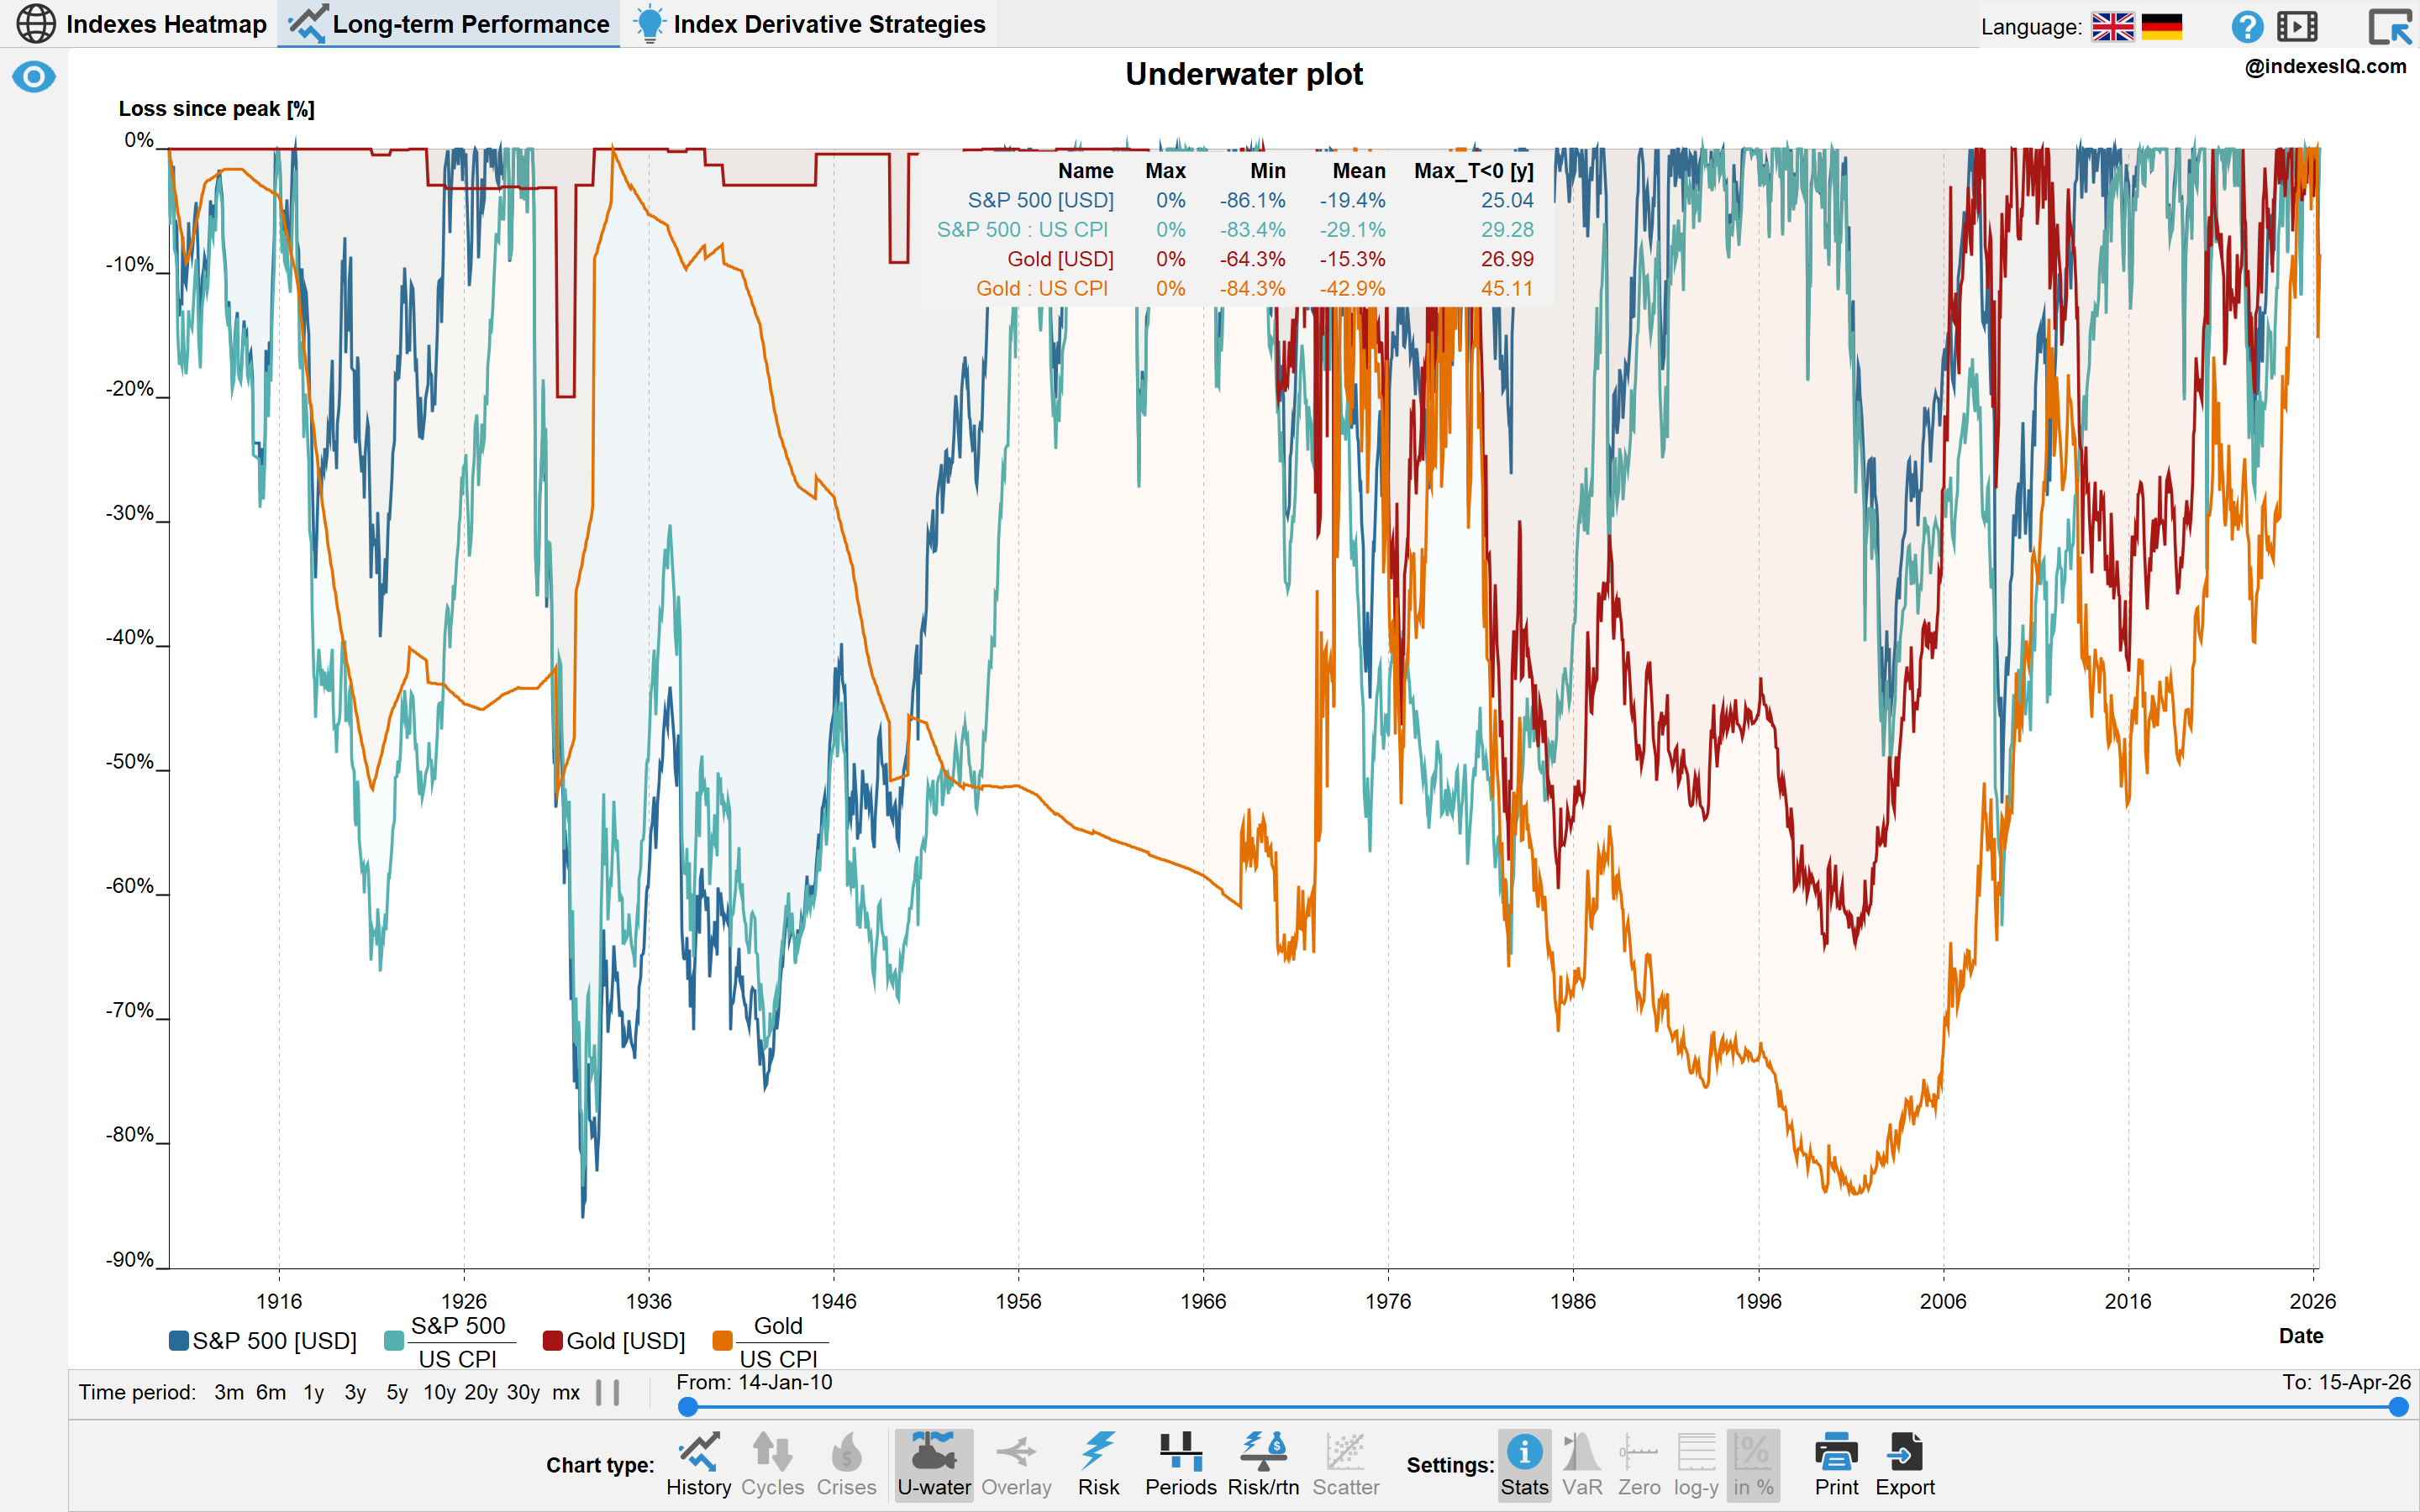
Underwater (drawdown) chart for the S&P 500 and gold, nominal and inflation-adjusted, 1910 to end of February 2026. Source: IndexesIQ.
Most discussions of investment risk focus on volatility — the standard deviation of returns, or metrics like Value-at-Risk. These are useful short-term measures. But for a long-term investor, they miss the dimension of risk that matters most: how long could you be under water?
The underwater chart — which shows the drawdown from the last all-time peak at each point in time — tells this story directly. It is one of the most powerful tools in the IndexesIQ app, and it produces some striking historical facts.
The S&P 500: 25 Years Under Water After 1929
The S&P 500 peaked in September 1929. In nominal terms, it did not recover that peak until late 1954 — a wait of 25 years. In real inflation-adjusted terms, the recovery took even longer. An investor who bought at the 1929 peak and measured their wealth in purchasing power terms spent the better part of three decades in the red.
This is not ancient history with no modern relevance. The same index took 13 years to recover in real terms from its 2000 dot-com peak, and over 6 years from its 2007 pre-financial-crisis peak. Volatility metrics computed over short windows would never have captured the true magnitude of these experiences.
Gold: 45 Years Under Water in Real Terms
Gold peaked in January 1980 at around $850 per ounce, driven by the inflation crisis and geopolitical turmoil of the late 1970s. In nominal terms, gold recovered that peak in 2008 — a 28-year wait. But in real inflation-adjusted terms, gold buyers in 1980 were still under water in 2025 — a recovery period of over 45 years.
This has important implications for the narrative that gold is an inflation hedge. Over short periods, it can be — as the 1970s demonstrated. But over the very long run, as we showed in Insight #1, gold's real return is near zero. And the 1980 peak illustrates a specific danger: buying an asset at the point of maximum narrative enthusiasm locks in the worst possible entry point for decades.
Inflation Adjustment Extends the Pain
A key insight from the underwater chart is that adding inflation adjustment consistently extends recovery periods. A nominal recovery to a previous peak does not restore purchasing power if inflation has been running in the meantime. For long-term investors who think in terms of real wealth — what their portfolio can actually buy — the nominal recovery date is almost irrelevant. The real recovery date is what counts.
This is why the inflation adjustment function in IndexesIQ shows both nominal and real underwater charts side by side. The gap between them is a direct measure of how much inflation compounds the pain of a drawdown.
What This Means for Asset Allocation
Recovery time is a function of both the depth of the drawdown and the subsequent rate of return. An asset that falls 80% needs to rise 400% just to break even. An asset that falls 50% needs to rise 100%. This asymmetry is why large drawdowns are so destructive to long-term wealth even when average returns look acceptable.
It also explains why the mix of assets in a long-term portfolio matters so much. The capital protection category of structured products exists precisely to limit drawdown depth — accepting a cap on upside in exchange for a floor on the downside, thereby shortening the potential recovery period. The trade-off is examined in detail in the Derivative Academy.
Explore It Yourself
The underwater chart is available in the IndexesIQ app for any index, with or without inflation adjustment, going back as far as the data allows. Select any index in the Heatmap pane and click the underwater chart button to see its full drawdown history. The Performance pane allows you to compare the underwater charts of multiple indexes simultaneously.
Volatility is a short-term risk measure. For long-term investors, the relevant question is: how long could you be under water? The S&P 500 took 25 years to recover from its 1929 peak in nominal terms. Gold buyers in 1980 waited over 45 years in real terms. Inflation adjustment consistently extends recovery periods — a nominal recovery does not restore purchasing power. Understanding drawdown recovery time should be central to any long-term investment decision.