
The Role of Inflation in Long-Term Investing
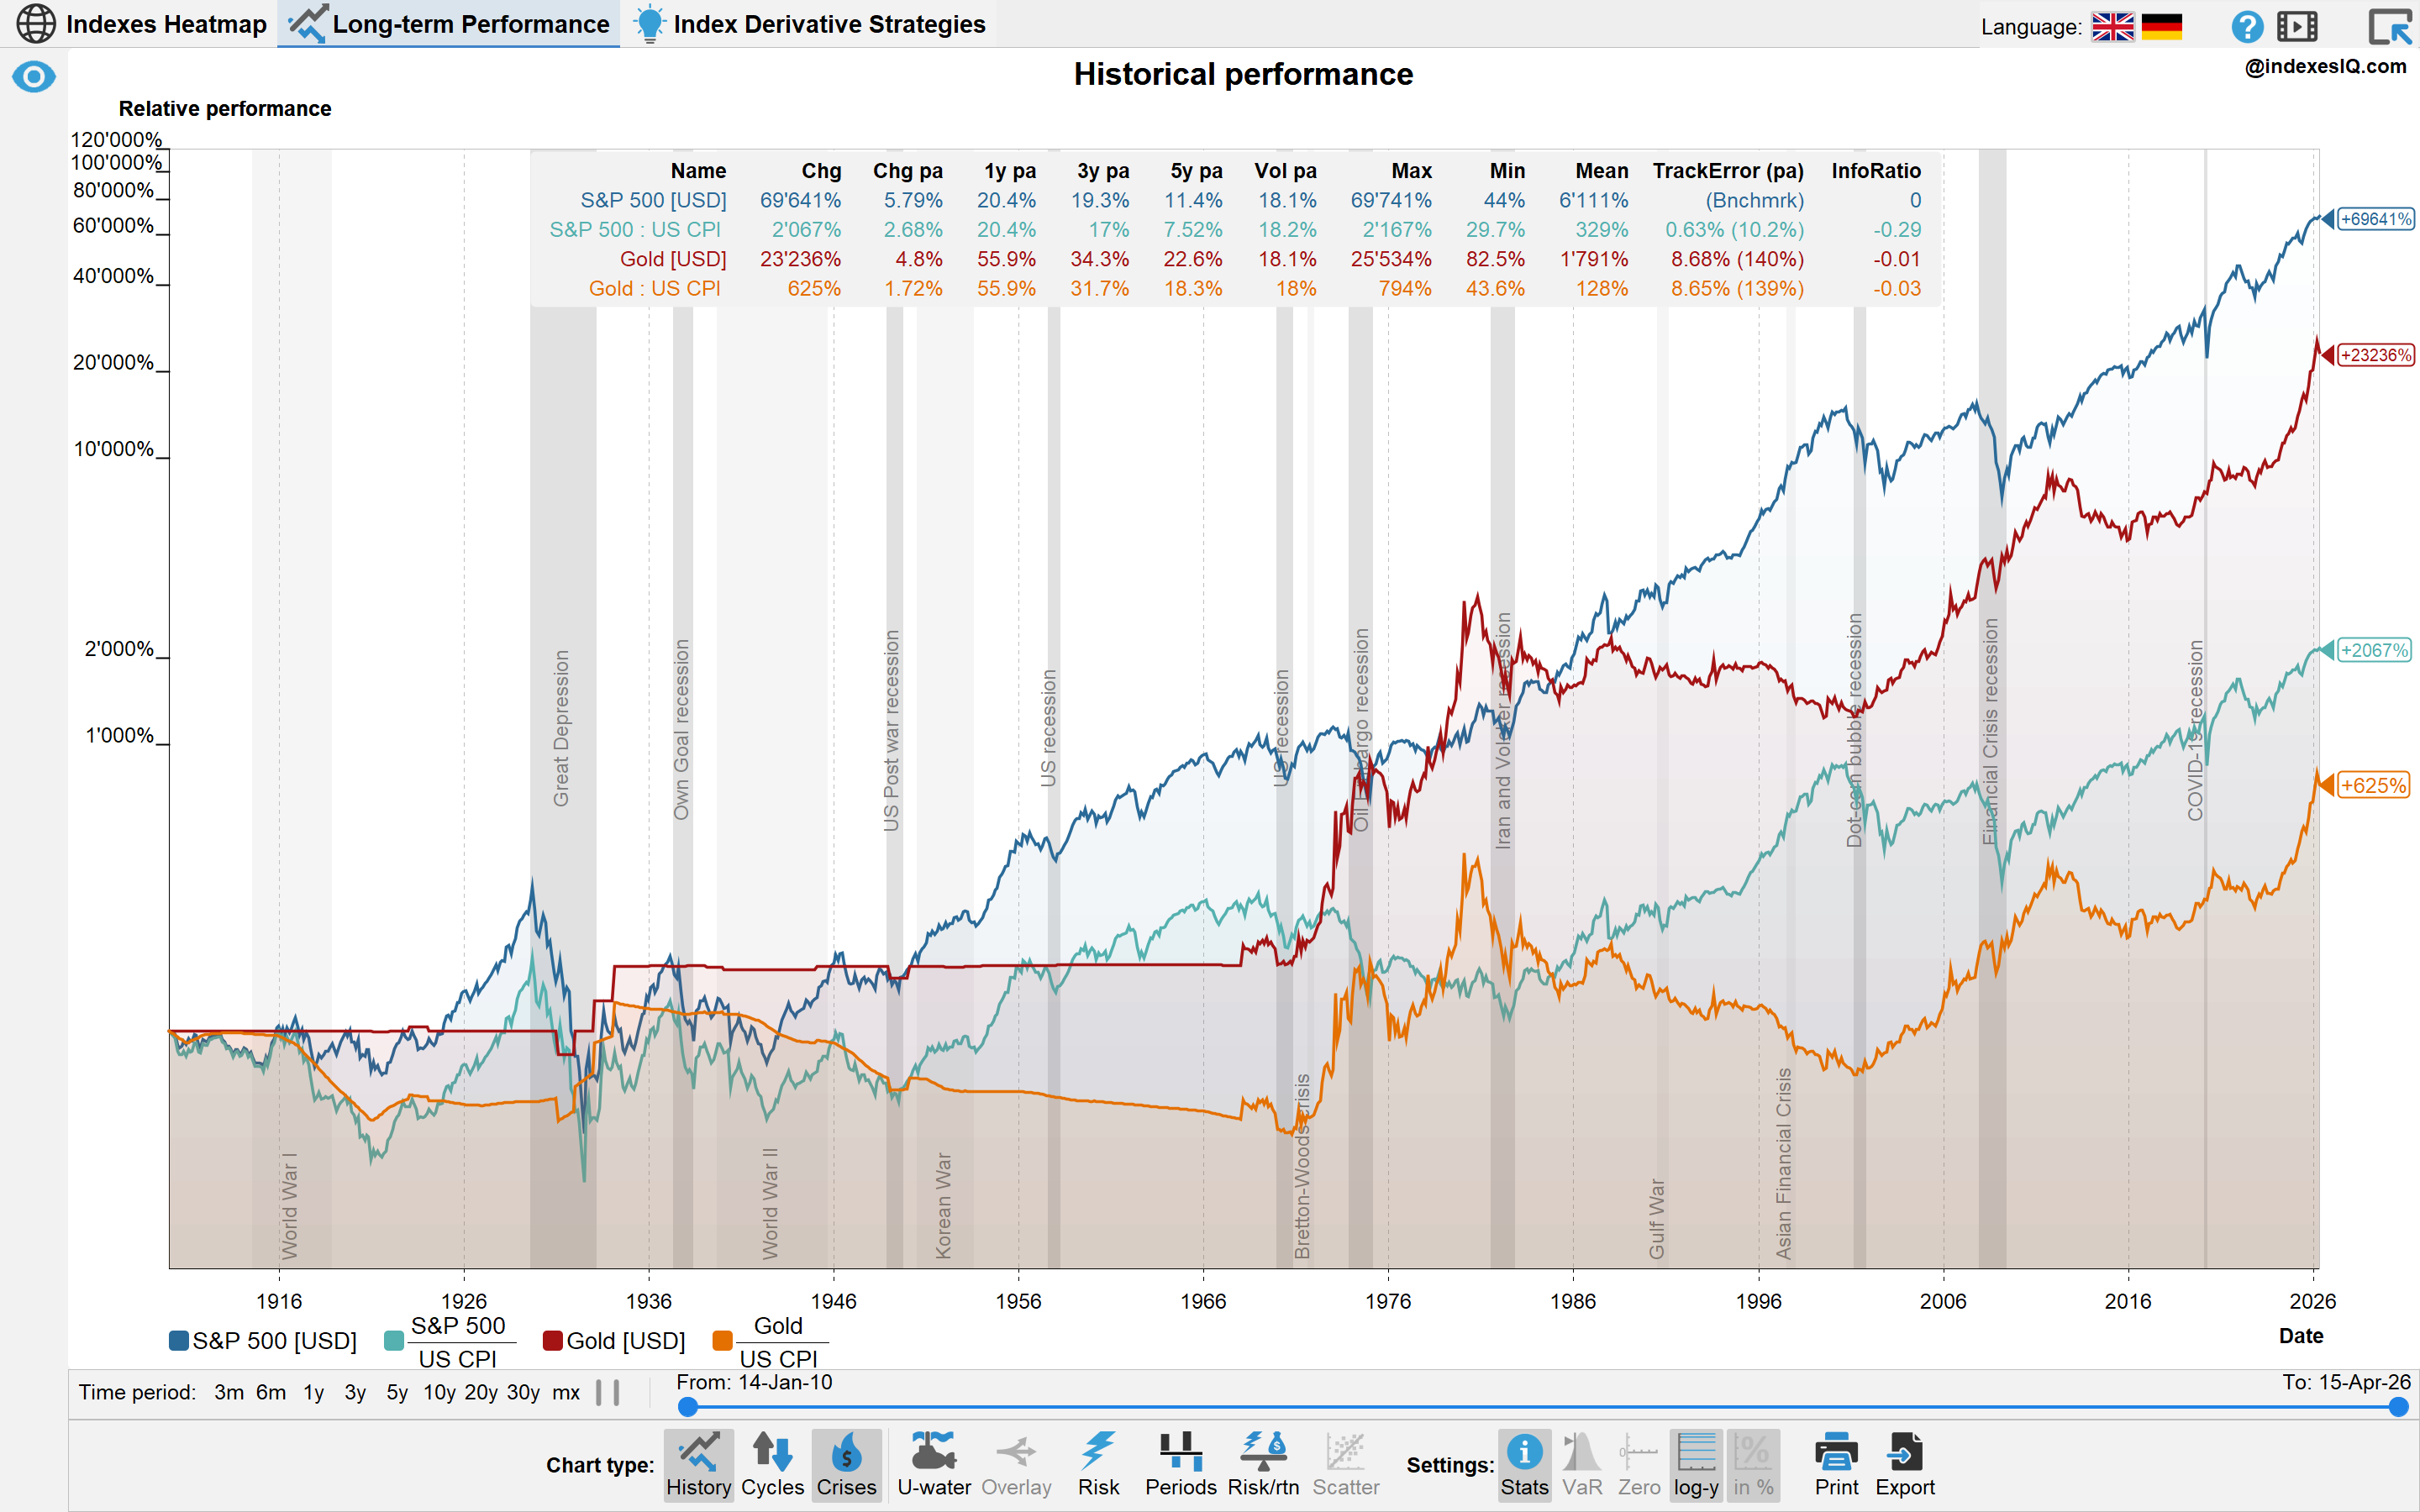
S&P 500 and gold — nominal versus inflation-adjusted cumulative returns, 1910 to end of January 2026. Source: IndexesIQ.
The S&P 500 returned +64,731% in nominal terms from 1910 to end of January 2026. In real terms — after adjusting for US consumer price inflation — that falls to +1,915%. The difference is not a rounding error. It is 116 years of compounding inflation silently eroding purchasing power.
Inflation is the most underestimated risk in long-term investing. It does not announce itself the way a market crash does. It works slowly, continuously, and in the background — but over decades its effect dwarfs almost every other variable. A nominal return that looks impressive can represent near-zero real wealth creation once inflation is accounted for.
The Gold Comparison
Gold tells an even starker story. In nominal terms, gold has appreciated substantially since 1910. In real inflation-adjusted terms, gold has delivered very little over the full 116-year period — its purchasing power today is not dramatically higher than it was in 1910. What gold has done is preserve purchasing power over the very long run, not grow it.
This matters because gold is often presented as an inflation hedge. Over short periods — most notably the 1970s — this is true. But over very long periods, gold's real return converges toward zero. An investor who bought gold at its 1980 peak waited over 45 years in real terms before breaking even. The recovery time from peak drawdowns is a critical but often overlooked dimension of investment risk — something we explore in detail in Insight #2.
What About Dividends?
The S&P 500 price index excludes dividends. The S&P 500 Total Return index — which reinvests dividends — tells a significantly better story in real terms. Dividends have historically contributed roughly 40% of the total long-term real return of the US equity market. This is why the choice of price-only versus total return index matters enormously for any long-term comparison — a point we examine in depth in Insight #3.
Explore It Yourself
The IndexesIQ app allows you to switch between nominal and inflation-adjusted returns for any index with a single click — using the inflation adjustment function available in both the Heatmap and the Performance pane. You can also use the Long-term Performance pane to plot the CPI index itself alongside any equity index to visualise exactly how much of a nominal return was simply keeping pace with rising prices.
Never judge an investment by its nominal return alone. The S&P 500's +64,731% nominal return since 1910 shrinks to +1,915% in real terms. Dividends add substantially to the real return picture — which is why total return indexes should always be used for long-term comparisons. And gold, while a reasonable short-term inflation hedge, has delivered near-zero real returns over the very long run. Inflation is not a footnote to investment returns. It is one of the central variables.