
"In the short run, the market is a voting machine. In the long run, it is a weighing machine."
The AI Boom in Global Equity Markets
Artificial intelligence has left measurable fingerprints across global equity markets — but not equally. The magnitude of the impact depends heavily on each market's exposure to the AI semiconductor supply chain. This four-part series examines the evidence market by market: Korea, Taiwan, Japan and the United States.
Each part of this series takes one market and one number that sits outside its own history, then traces it back to the handful of companies responsible. Together they show how unevenly the AI boom has landed across global equity markets — concentrated in a few names in Asia, diluted by breadth in the US.
In this series:
- How big is Korea's outlier? — The KOSPI's +227%, and how Samsung and SK Hynix's grip on HBM memory explains it
- Is Taiwan even more concentrated? — TSMC and a TAIEX reading that breaks its entire 30-year historical range
- What does Japan's NT ratio reveal? — SoftBank, Tokyo Electron and Advantest, and a 32-year high in the Nikkei vs TOPIX split
- Is the NASDAQ bigger than the dot-com bubble? — Two ratios above their 2000 peaks, and Soros's theory of what makes a bubble
You can read the series in order, or jump straight to the part that interests you most.
Part 1 of 4
The KOSPI's Extraordinary Year — South Korea's +227% Outlier
Chart 1: KOSPI Yearly Performance Overlay, 1981–May 2026
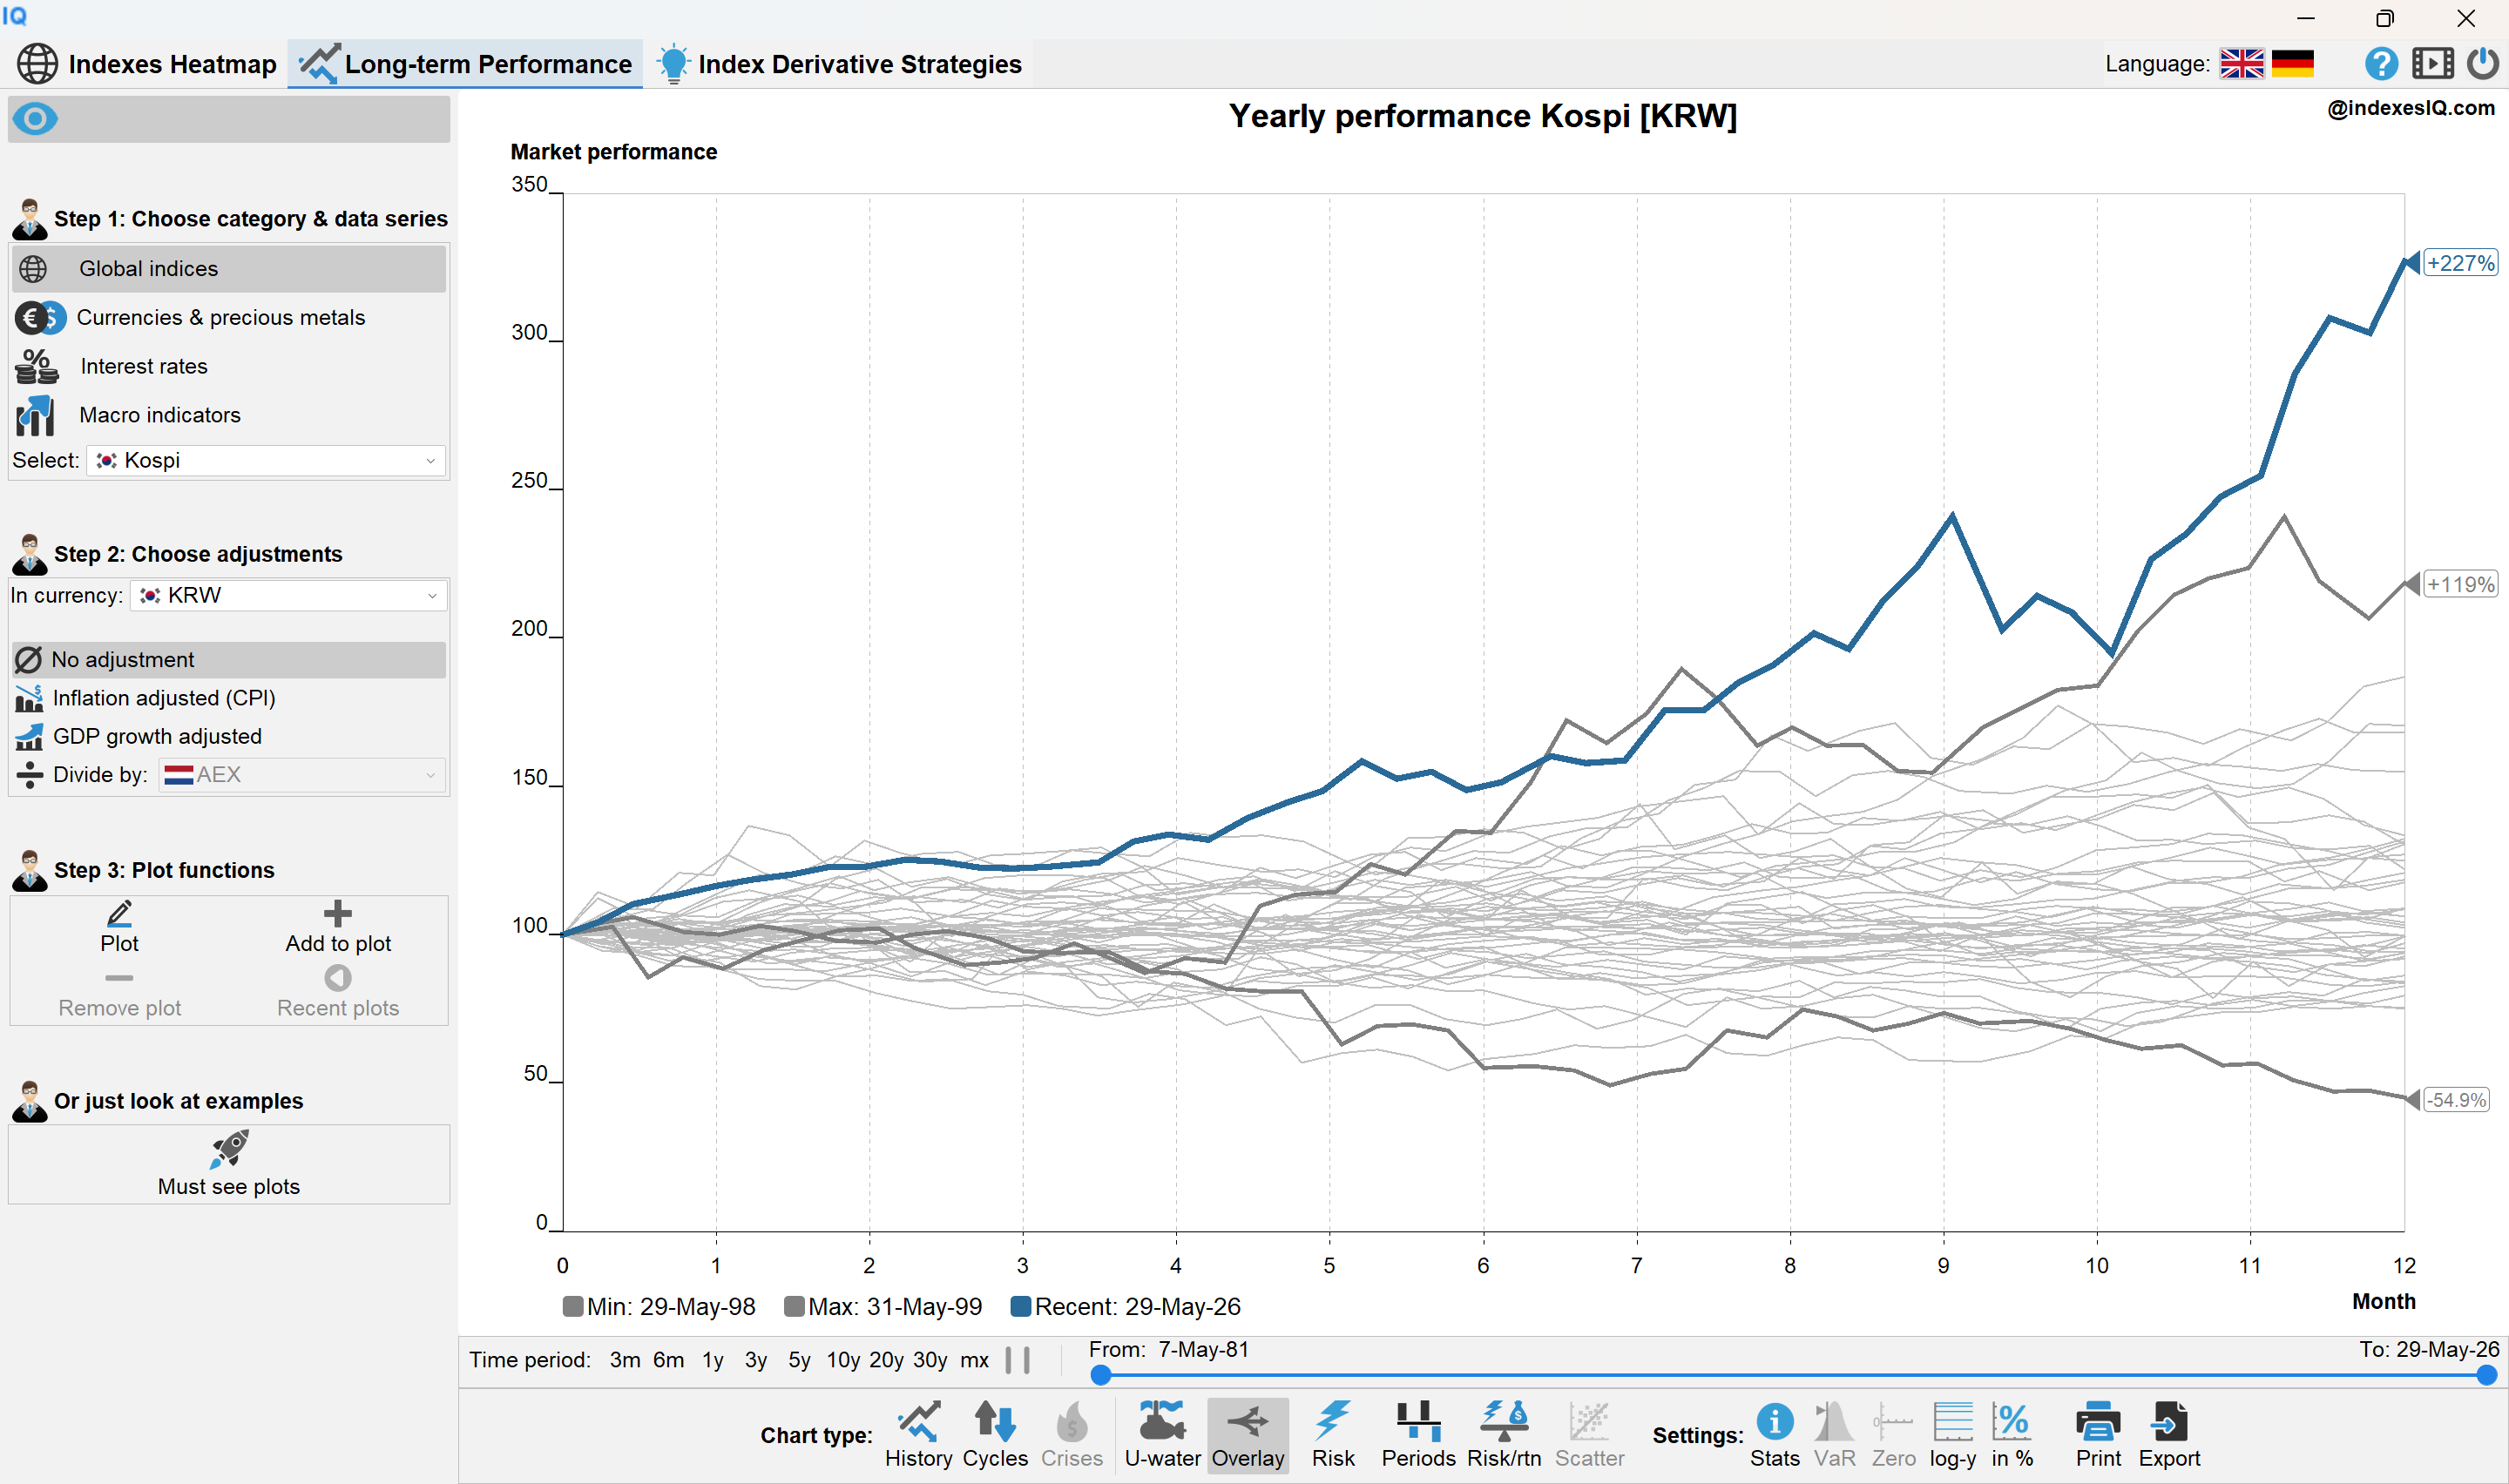
KOSPI yearly performance overlay, 1981 to end of May 2026. The past 12 months show +227% — far outside the historical distribution. Source: IndexesIQ.
The KOSPI — South Korea's flagship equity index — returned +227% over the 12 months to end of May 2026. To put this in context: the next highest yearly return in the KOSPI's history since 1981 was approximately +100%. The current reading is not just at the top of the historical distribution. It is outside it entirely.
The explanation is concentrated in two companies: Samsung Electronics and SK Hynix, which together account for a dominant share of the KOSPI's total market capitalisation. Both are global leaders in High Bandwidth Memory (HBM) — the specialised DRAM chips that are essential for training and running large AI models. Demand for HBM has exploded alongside the buildout of AI infrastructure by US technology companies.
This is not a story about the Korean economy broadly. GDP growth in Korea has been moderate. The +227% return reflects a single concentrated theme: Korea's position as an indispensable supplier in the global AI semiconductor supply chain.
The KOSPI's +227% is a semiconductor story, not a Korea story. Samsung and SK Hynix's dominance of HBM production has made Korea the most direct equity beneficiary of the AI infrastructure boom. The overlay chart in the IndexesIQ app shows how far outside historical norms this reading sits.
Jump to: Part 1 · Part 2 · Part 3 · Part 4
Part 2 of 4
The AI Boom in Taiwan — TSMC and the TAIEX Outside Its 30-Year Range
Chart 2: TAIEX Yearly Performance Overlay, 1991–May 2026
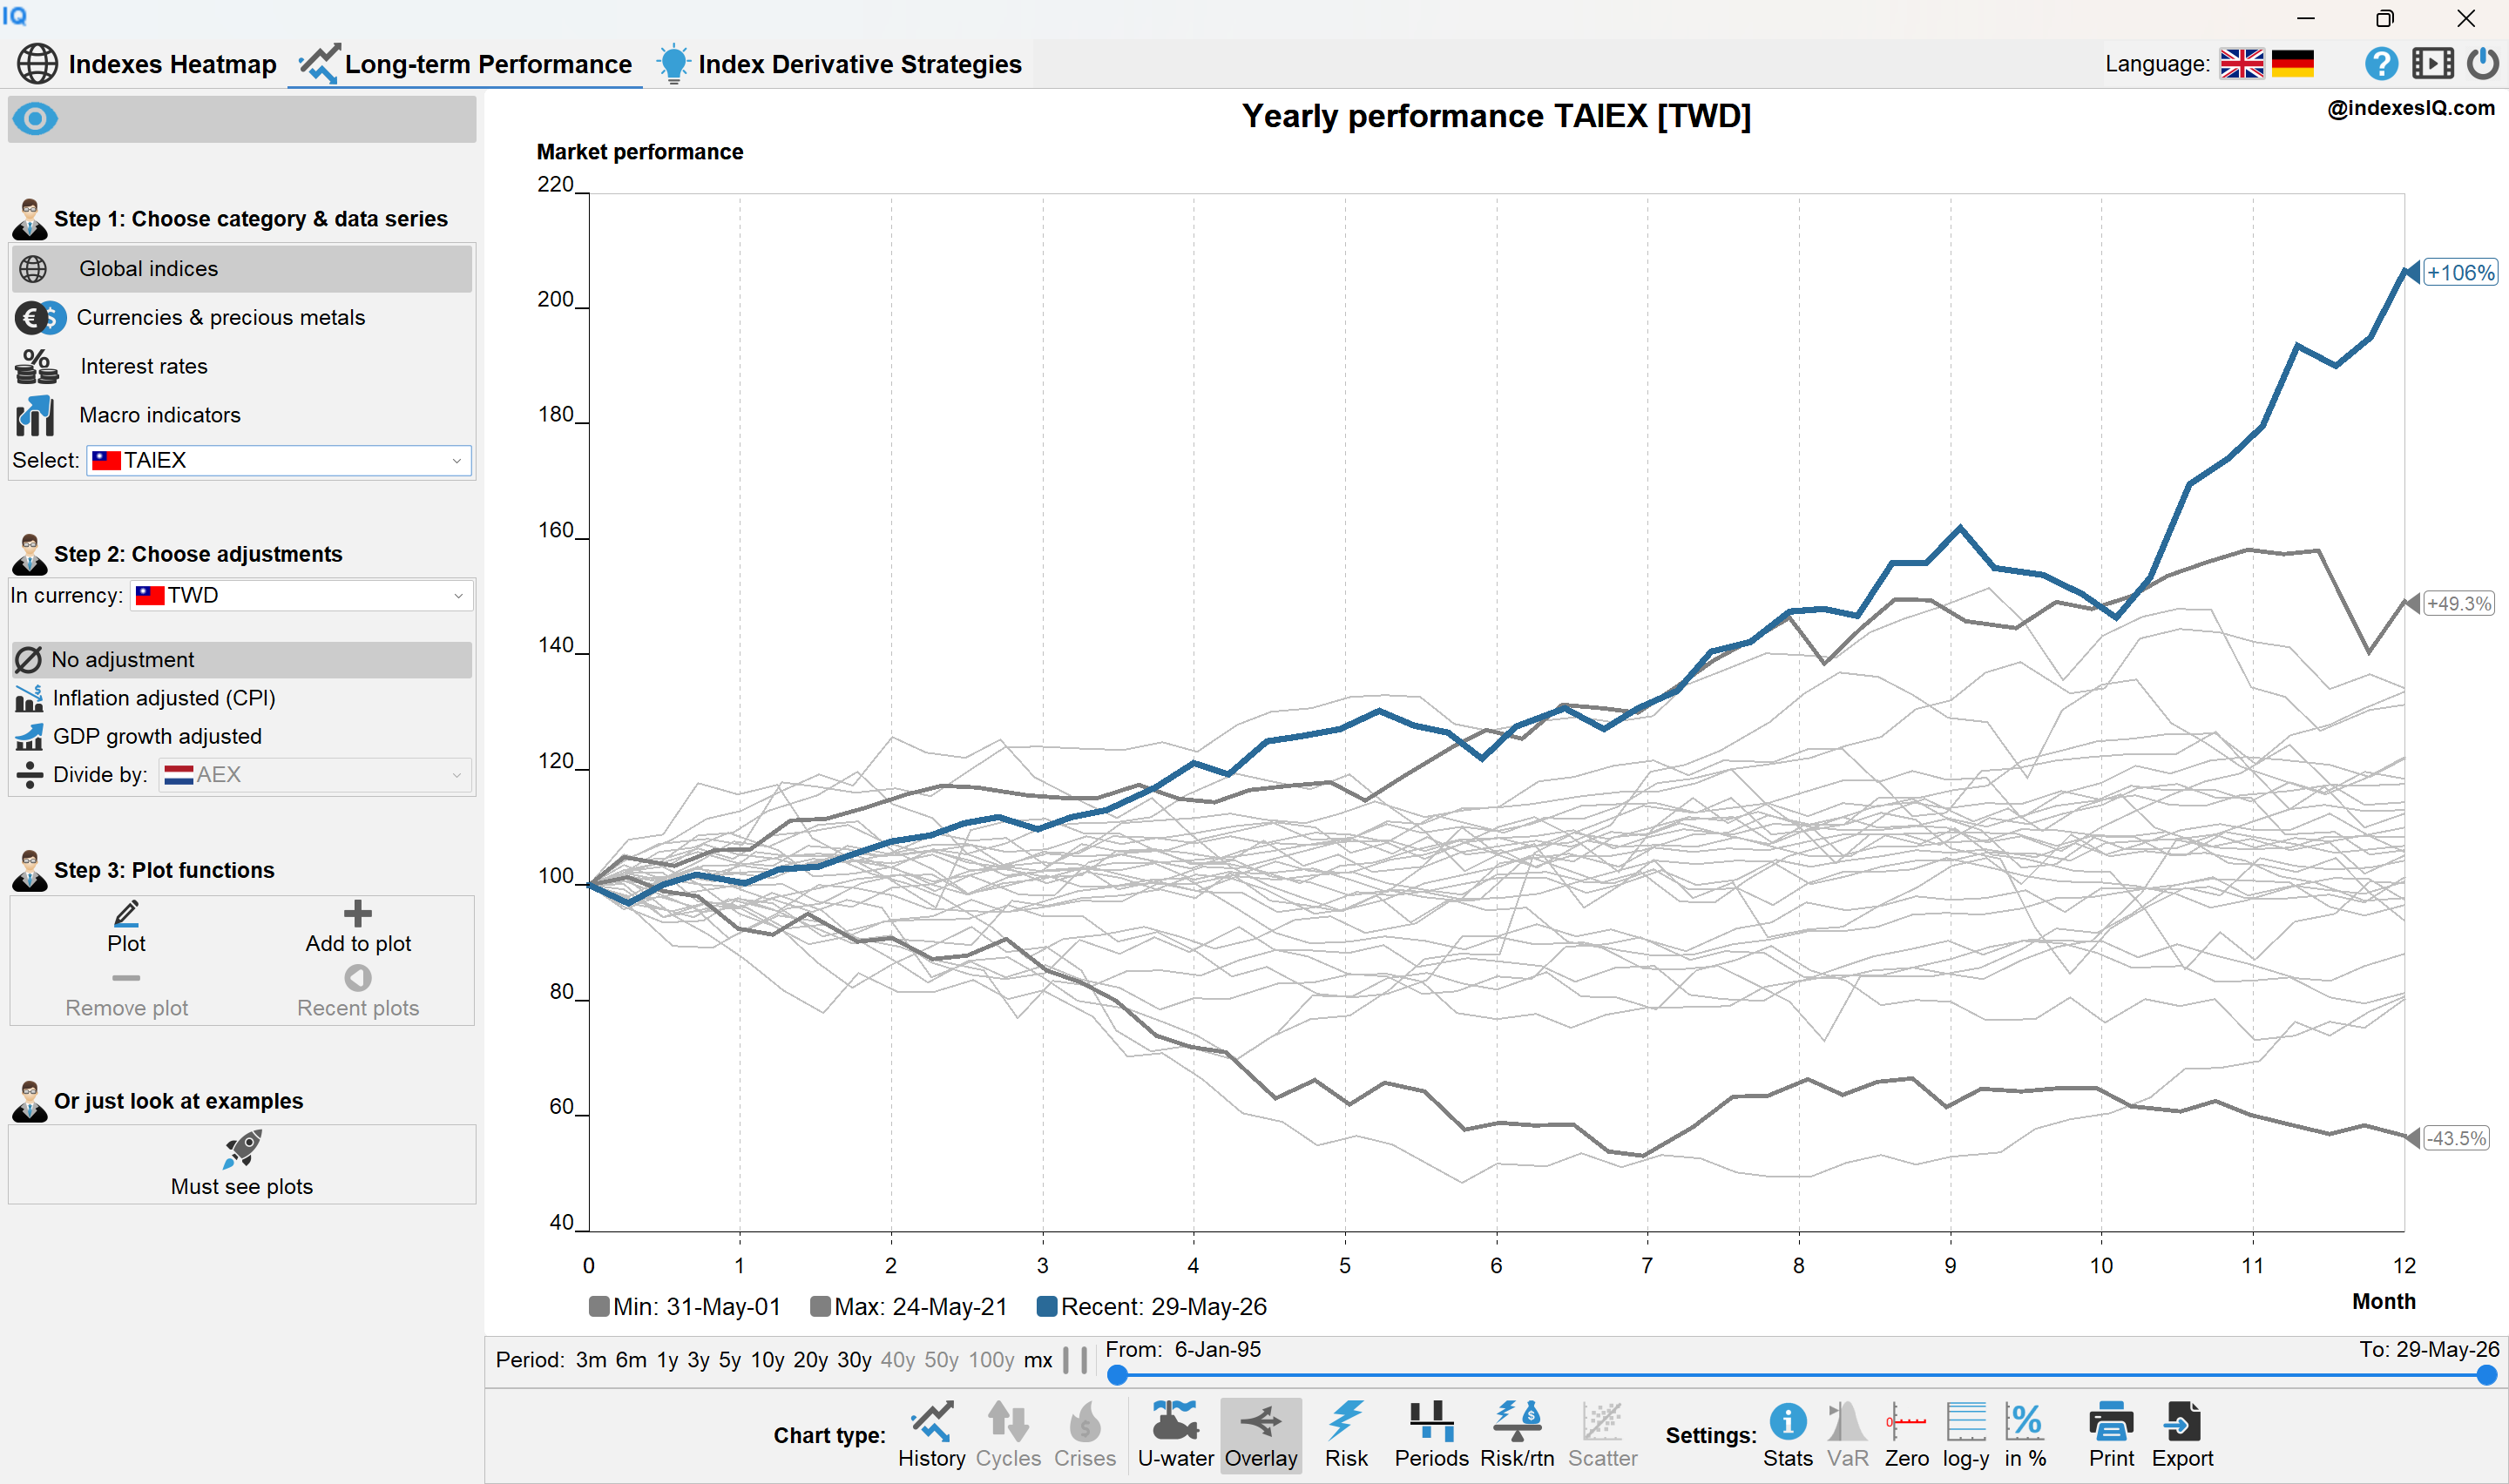
TAIEX yearly performance overlay, 1991 to end of May 2026. The +106% reading breaks outside the entire 30-year historical range. Source: IndexesIQ.
Taiwan's TAIEX returned +106% over the 12 months to end of May 2026 — a reading that breaks outside the entire 30-year historical distribution of the index's yearly performance. The driver is TSMC (Taiwan Semiconductor Manufacturing Company), which manufactures the advanced chips that power AI systems and accounts for roughly 30% of the TAIEX's total market capitalisation.
TSMC's monopoly position in cutting-edge chip fabrication — specifically its 3nm and 2nm process nodes — makes it the single most critical company in the global AI supply chain. No other foundry in the world can manufacture at these scales in volume. When AI infrastructure spending accelerates, TSMC benefits directly and disproportionately.
The Taiwan story also illustrates the concentration risk that comes with an index dominated by a single company or theme. A +106% return is remarkable; so is the fact that a single company's fortunes can move an entire national market index by that magnitude.
The TAIEX's +106% breaks its entire 30-year historical range — driven almost entirely by TSMC's irreplaceable position in the AI chip manufacturing supply chain. Index concentration risk cuts both ways: the same dominance that amplified gains on the way up would amplify losses if the AI investment cycle turns. The correlation matrix in the IndexesIQ app shows how tightly the TAIEX and KOSPI now move together.
Jump to: Part 1 · Part 2 · Part 3 · Part 4
Part 3 of 4
Japan's NT Ratio at a 32-Year High — The AI Divide Within the Market
Chart 3: Japan NT Ratio (Nikkei 225 / TOPIX), 1990–May 2026
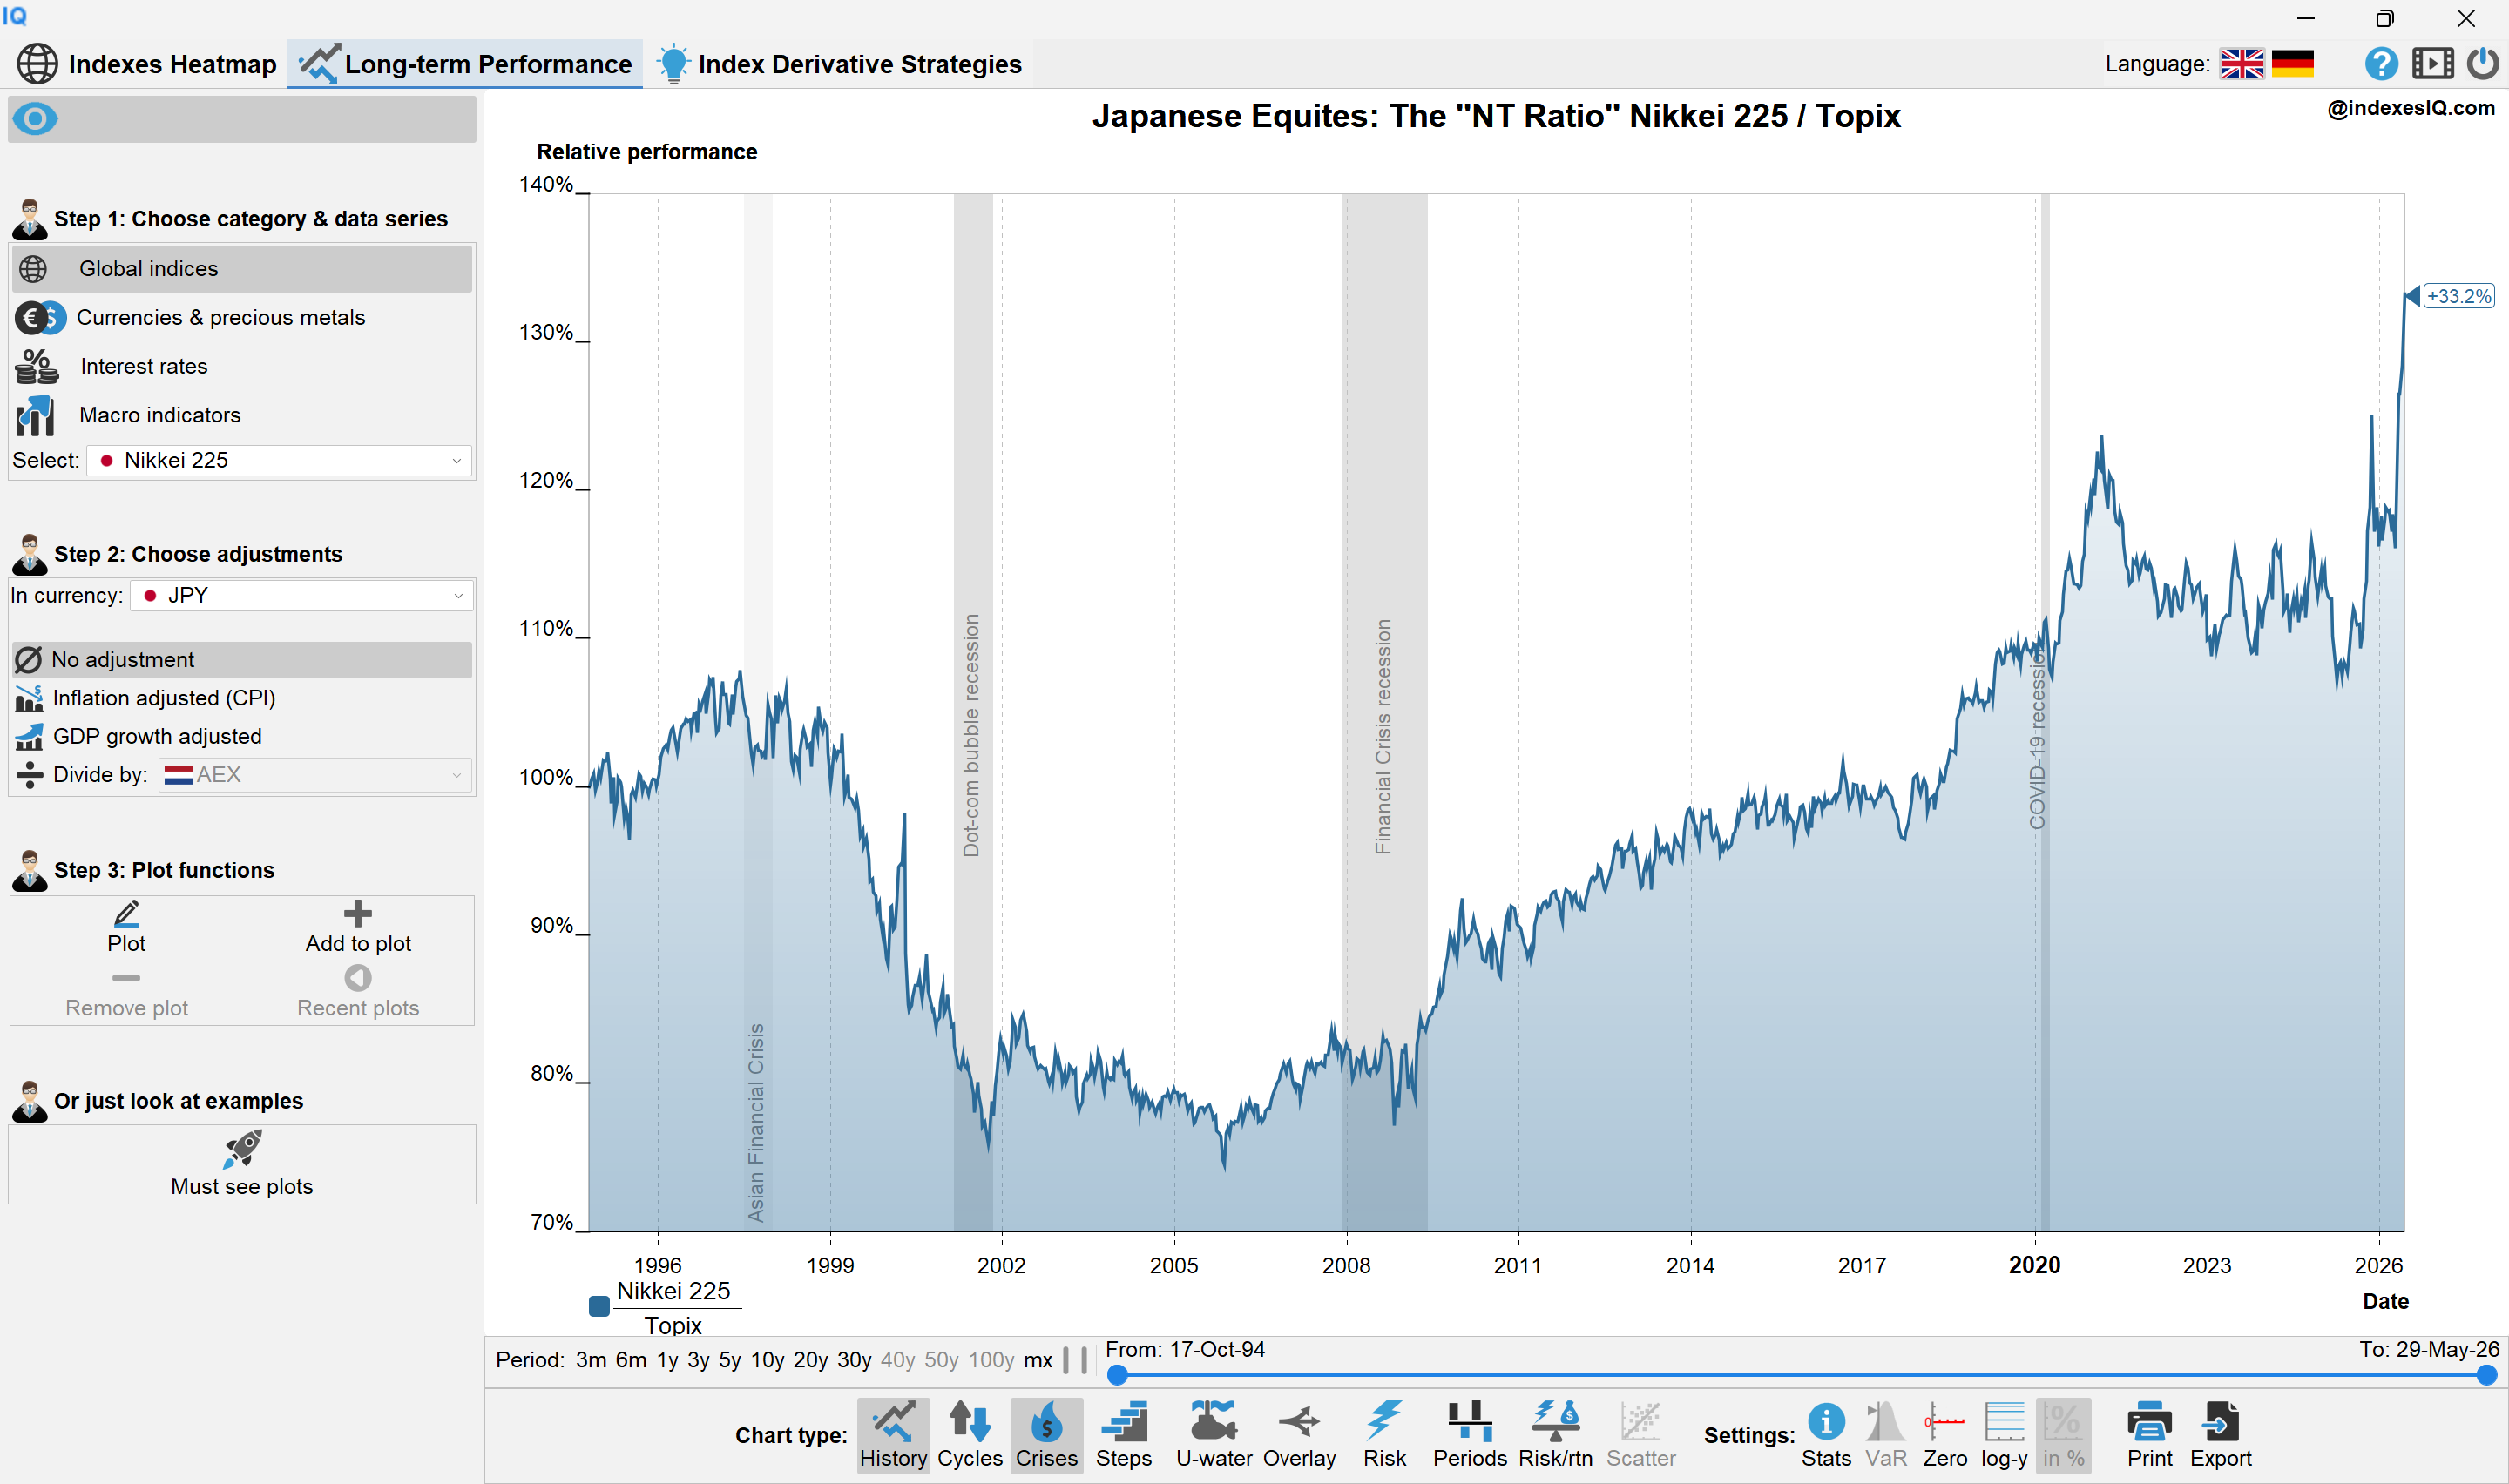
Japan's NT ratio (Nikkei 225 / TOPIX), 1990 to end of May 2026. The ratio has reached its highest level since 1994. Source: IndexesIQ.
Japan's AI story is more nuanced than Korea's or Taiwan's — and it is best read through the lens of the NT ratio: the Nikkei 225 divided by the TOPIX. When this ratio rises, it means the Nikkei is outperforming the broader TOPIX — a signal that large-cap, internationally exposed names are pulling ahead of the broader domestic market.
The NT ratio has reached its highest level since 1994 — a 32-year high. The driver is a small number of AI-exposed names: SoftBank (which holds a large stake in Arm Holdings), Tokyo Electron (semiconductor equipment) and Advantest (chip testing). These companies have seen extraordinary share price appreciation, pulling the Nikkei significantly above the broader TOPIX.
The NT ratio's 32-year high tells an important story about the structure of the AI boom in Japan: it is not a broad-based domestic recovery. It is a concentrated bet on a handful of companies that sit at the intersection of Japan's traditional semiconductor equipment strength and the global AI infrastructure buildout.
Japan's AI story is an intra-market divergence story. The NT ratio at a 32-year high shows that foreign capital is concentrating in a small number of AI-exposed large-caps — SoftBank, Tokyo Electron, Advantest — while the broader TOPIX lags. The divide function in the IndexesIQ app lets you replicate the NT ratio for any two indexes.
Jump to: Part 1 · Part 2 · Part 3 · Part 4
Part 4 of 4
The AI Boom at the Epicentre — The NASDAQ at the Upper End of History
Chart 4: NASDAQ / S&P 500 and NASDAQ / Russell 2000 Ratios, September 1987–May 2026
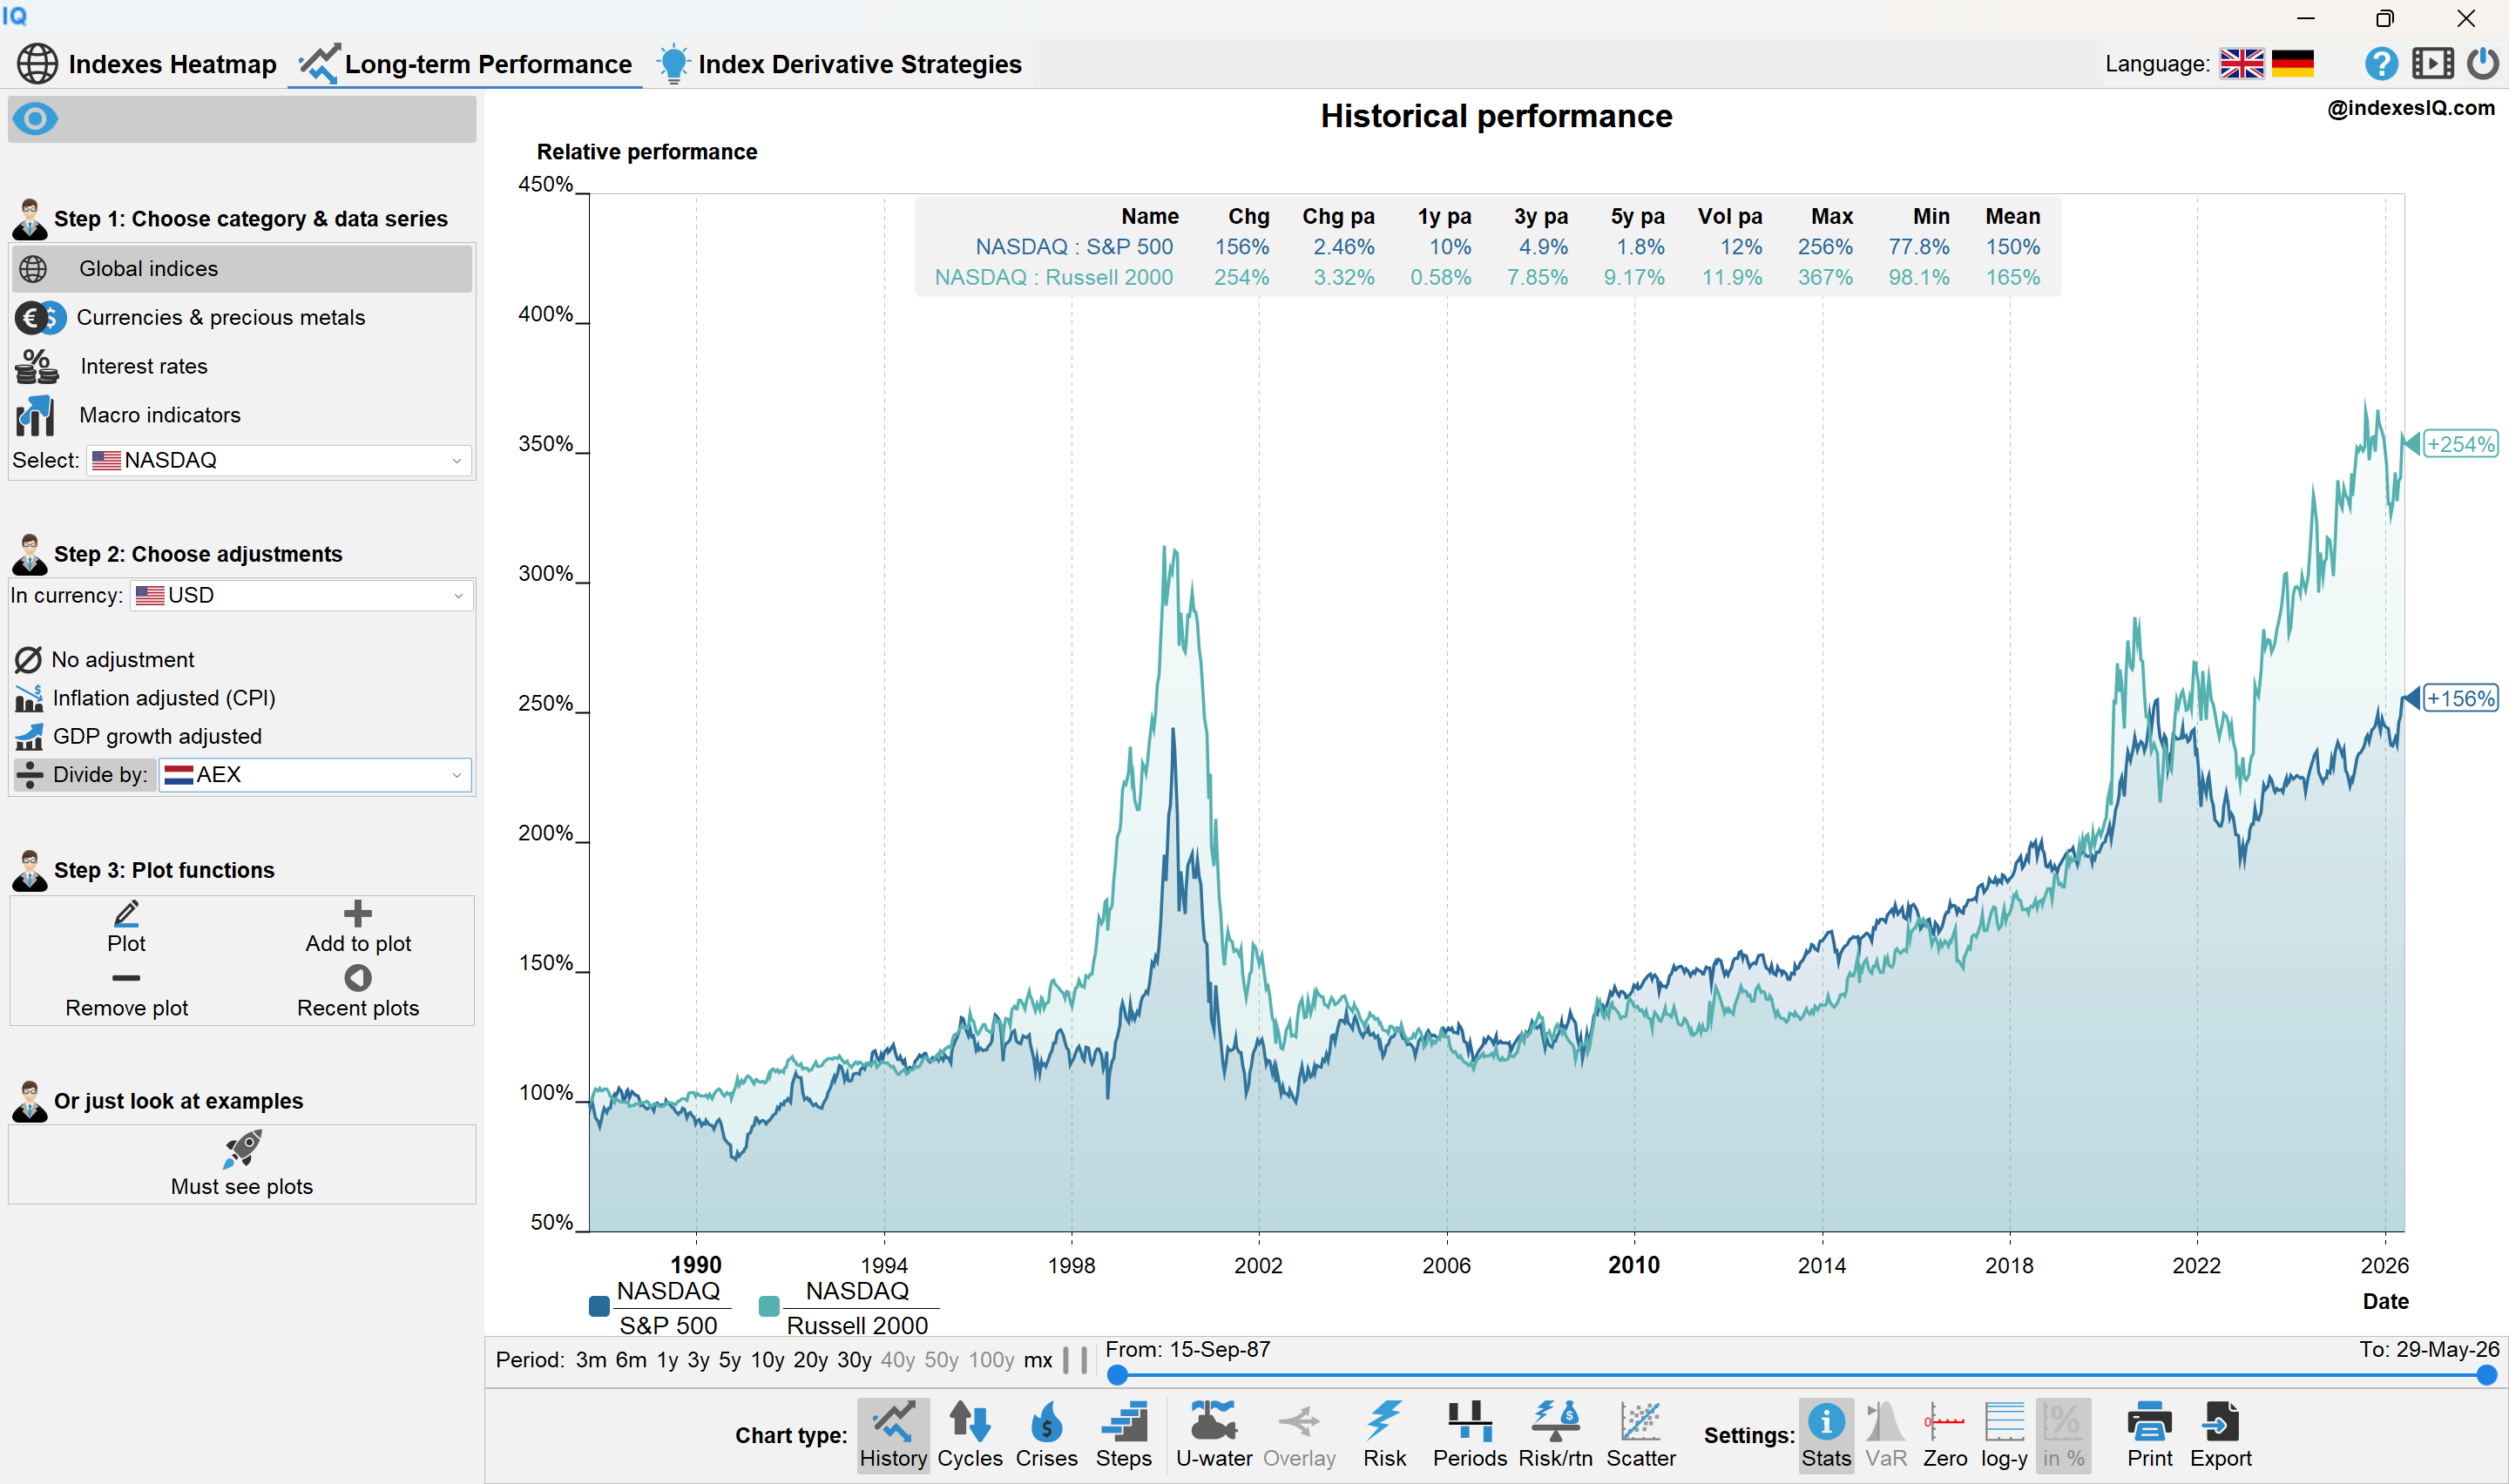
NASDAQ / S&P 500 and NASDAQ / Russell 2000 ratios indexed to 100 in September 1987. By end of May 2026, the ratios stand at 156 and 254 respectively — both above their dot-com peaks. Source: IndexesIQ.
Chart 5: NASDAQ Yearly Performance Overlay
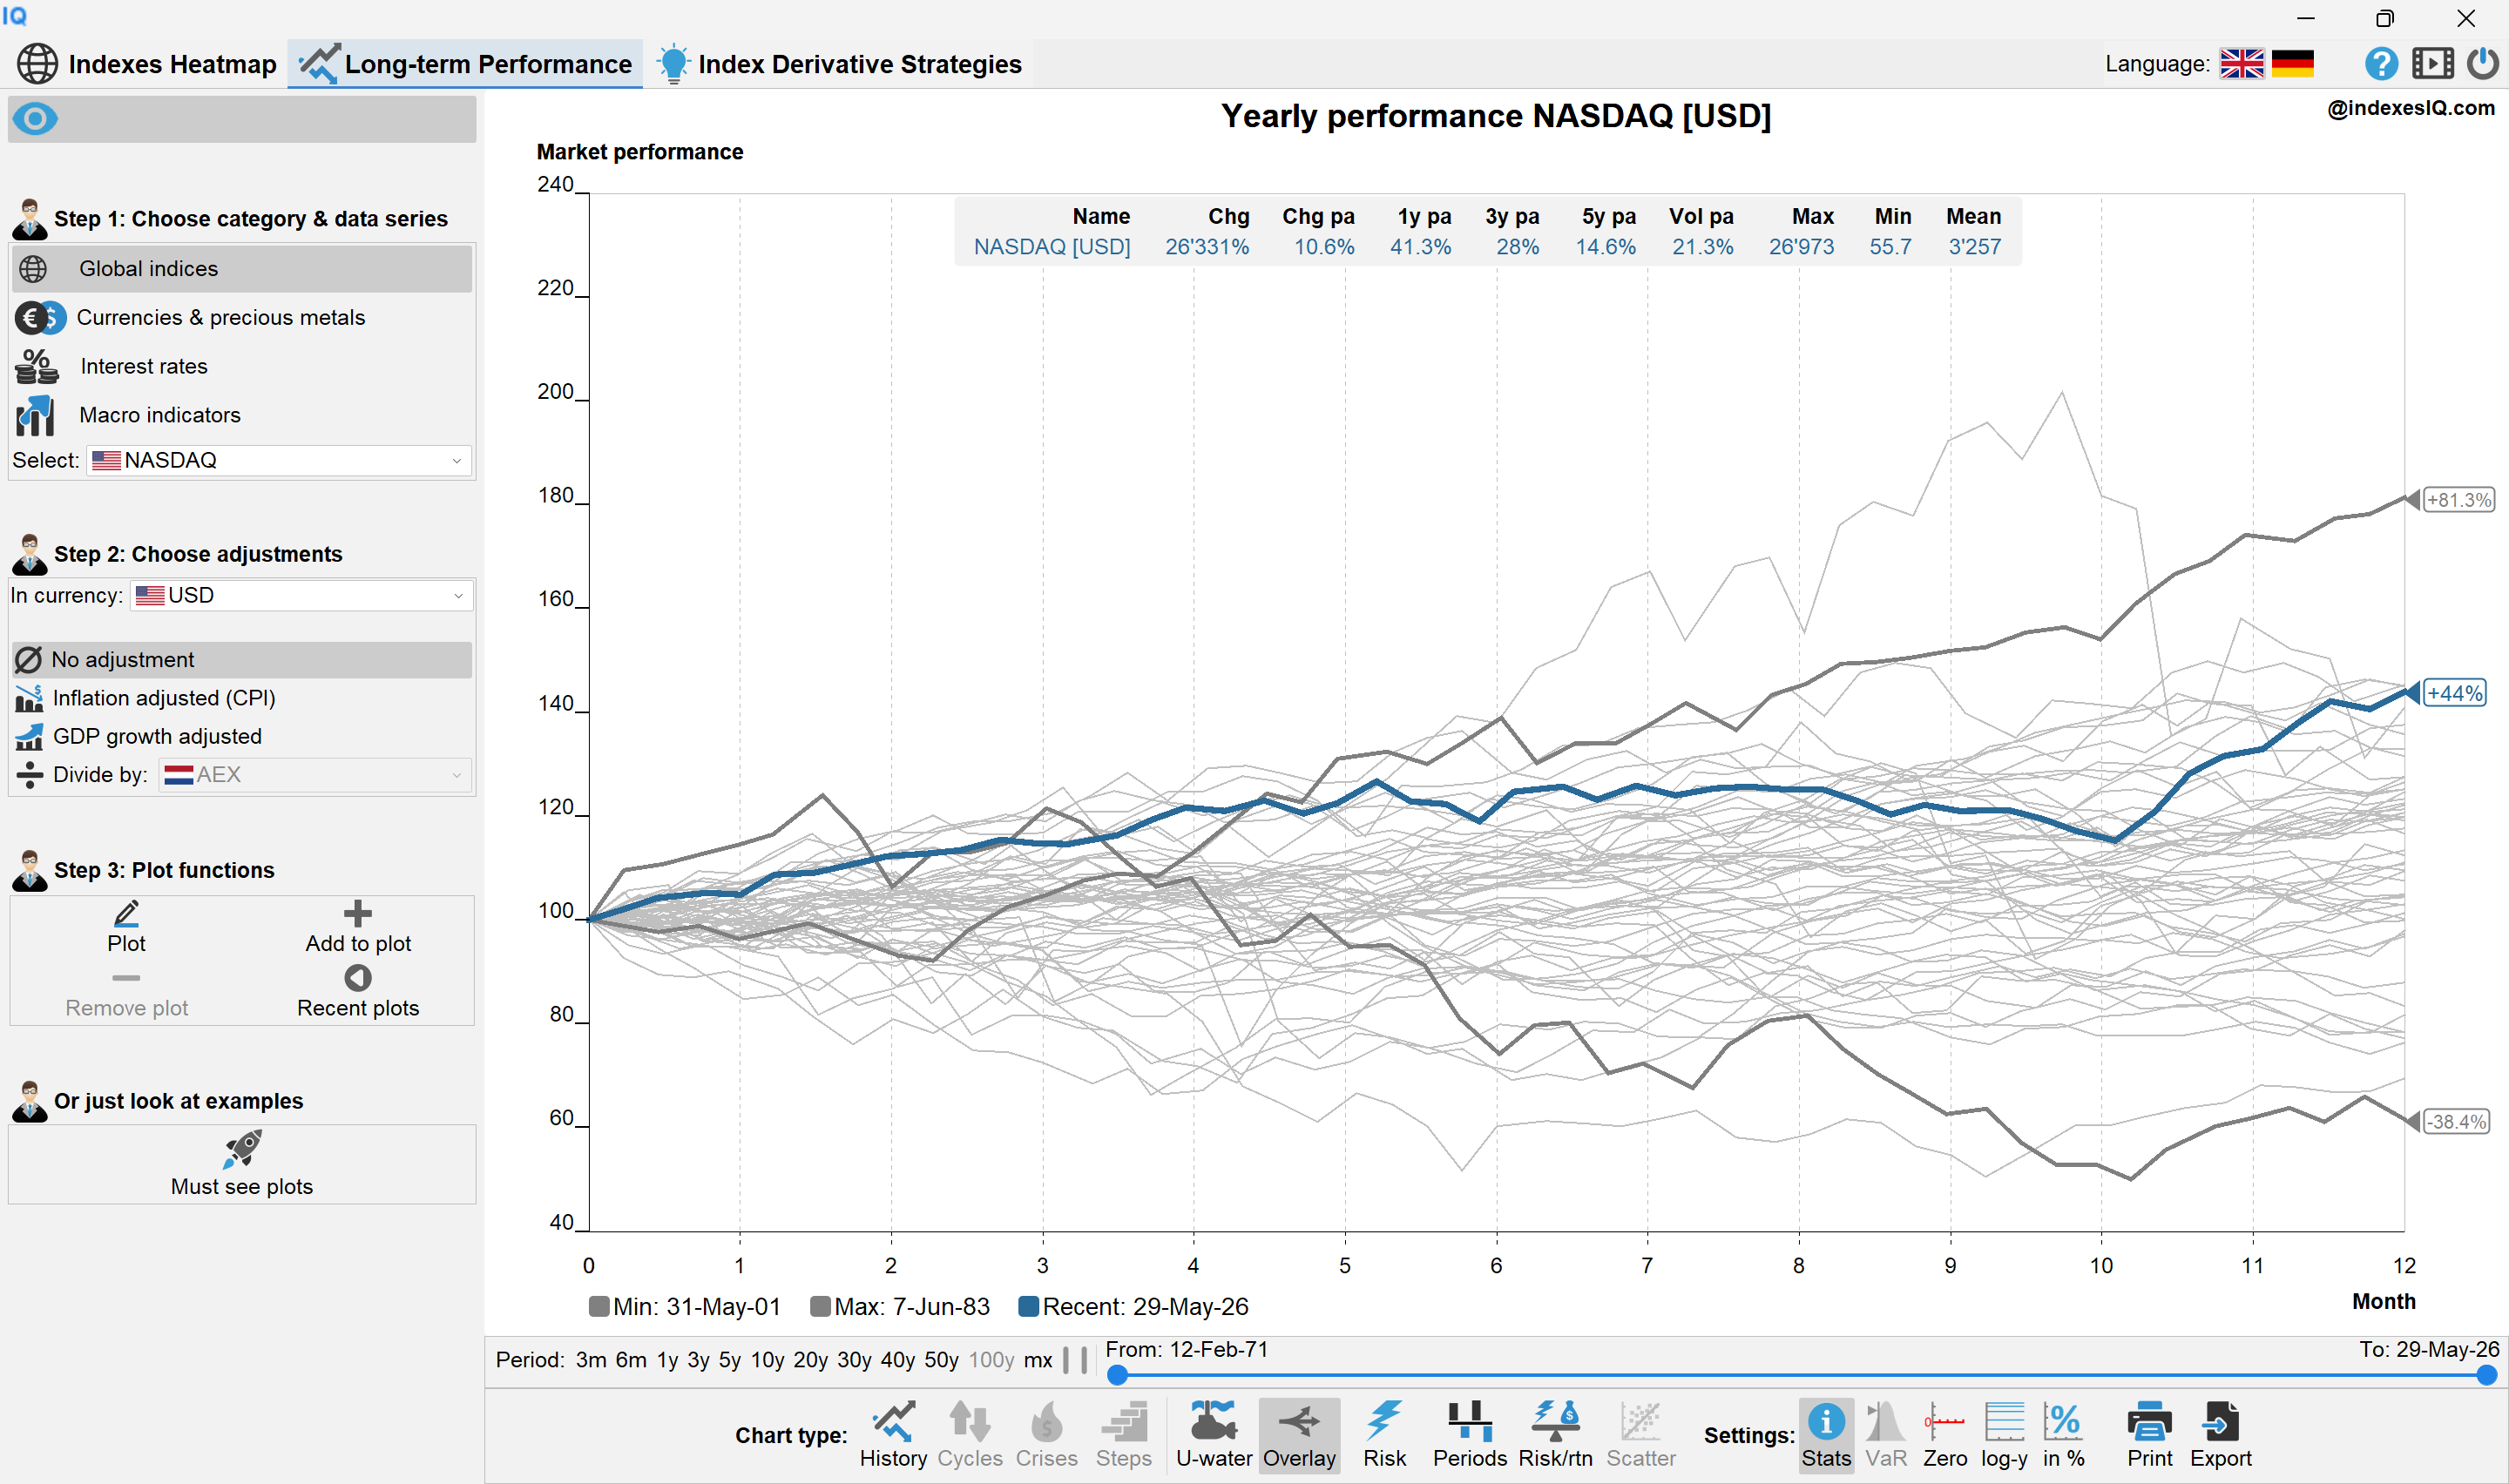
NASDAQ yearly performance overlay. The past 12 months end at +44% — at the upper end of the historical distribution but within the range set by prior years. Source: IndexesIQ.
The US story is different in character from what we saw in Asia — but no less striking. Chart 4 tells it in two ratios: the NASDAQ relative to the S&P 500 now stands at 156, and the NASDAQ relative to the Russell 2000 at 254 — both above their dot-com peak levels. In other words, tech's dominance over the rest of the US equity market is today more extreme than it was at the height of the dot-com bubble.
Chart 5 tells a different story: the NASDAQ's 12-month performance of +44% to end of May 2026, while at the upper end of its historical distribution, is not outside it. The historical range runs from −38% (the dot-com crash) to +81% (1983). This is a crucial contrast with Asia: in Korea, Taiwan and Japan, the AI theme is concentrated in a small number of names large enough to move an entire national index. In the United States, the same theme plays out within a corporate market of extraordinary breadth — 500 companies in the S&P 500, 2,000 in the Russell 2000. The AI rally is just as real, but somewhat diluted at the index level by sheer diversity.
"Every bubble has two components: an underlying trend that prevails in reality and a misconception relating to that trend."
Across all four markets in this series, the underlying trend is real. AI infrastructure spending is documented in the capital expenditure plans of the world's largest technology companies. The first half of Soros's formulation is clearly present. The question his framework poses — and the one that Graham's weighing machine will eventually answer — is whether a misconception has yet attached itself to that trend.
The KOSPI at +227%, the TAIEX at +106%, the NT ratio at a 32-year high and the NASDAQ / Russell 2000 ratio above its dot-com peak: these are not normal readings. Whether they ultimately reflect a permanent structural transformation of the global economy, or a good idea carried to excess, is the question every investor with exposure to these markets must sit with.
Until Graham's weighing machine delivers its verdict: don't call a bubble before it bursts.
The NASDAQ's +44% sits at the upper end of history but within it. The NASDAQ / Russell 2000 ratio at 254 is above its dot-com peak. Tech's dominance over the rest of the US market has never been wider. But the US market's breadth dilutes the AI theme at the index level in a way that Korea, Taiwan and Japan cannot. The AI boom is real. Whether a misconception has attached itself to it is the question Graham's weighing machine will eventually answer. Use the divide function in the IndexesIQ app to replicate the NASDAQ / Russell 2000 ratio yourself and scroll back through history to see the full context.
Jump to: Part 1 · Part 2 · Part 3 · Part 4