
Chapter 8 — Backtester
Historical backtesting of structured product market value and Value-at-Risk, with periodic roll-over strategies and barrier hit simulation.
The Backtester allows you to backtest the value and risk profile (Value-at-Risk) of a structured product over longer periods of time, using weekly re-valuations going back in time. Understanding the historical behaviour of a strategy's VaR alongside its market value is a key part of assessing its long-term suitability — for context on what Value-at-Risk means, see Chapter 1 of the Derivative Academy.
In addition, you can perform advanced backtests which include a frequent roll-over strategy of the underlying product. You can simulate investment strategies that invest into a structured product; when the product matures, the pay-off is rolled over into a new structured product of the same type with the same lifetime. It is therefore important to reset key parameters of the structured product — such as the maturity, the strike, the barrier, or the contract size of options — at each roll-over, using the replication rules in the rule modeller. In essence, this is the most realistic way of backtesting long-term investment strategies in a given structured product.
In the menu bar of the Backtester, the following settings are available:

Set period: Enter the time period of the backtest. The backtester uses weekly re-valuations throughout this period. Longer periods provide more data points and allow the simulation to cover multiple market cycles — including crashes, recoveries and prolonged sideways periods.

Set strategy: The strategy menu is a key function of the Backtester and allows you to define the underlying strategy for rolling the pay-off from one structured product to the next. See the roll-over options below.
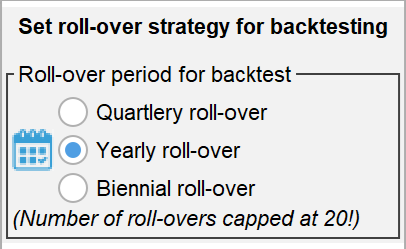
The backtest strategy menu. Select roll-over frequency and configure replication rules for how product parameters (strike, barrier, contract size) are reset at each roll-over.
Within the strategy menu, you can choose between three roll-over frequencies:
Quarterly roll-over: Uses a quarterly roll-over into a new product. Suitable for shorter-maturity yield enhancement products such as barrier reverse convertibles, which are typically issued with 3-month maturities.
Yearly roll-over: Uses a yearly roll-over into a new product. Suitable for capital protection products and medium-term participation certificates.
Biennial roll-over: Uses a biennial (two-year) roll-over into a new product. Suitable for longer-maturity capital protection products.
During the backtest, the composition rules are re-run at each roll-over to calculate the values of barriers, strikes etc.
Once you have defined the time period and strategy, use the following function to run the simulation:

Backtest! — Run the historical backtest and display the result in the plot window.
The Show menu then allows you to choose between four different output plots:
- Historical performance of the market value of the product and its VaR over time — the primary backtest view, showing how the product's value and risk profile evolved week by week.
- Compare the historical market value of the product to the value of the underlying index — directly answers whether the structured product outperformed or underperformed a direct investment.
- Evolution of the ratio (VaR / market value of the product) over time — used to assess the development of the relative riskiness of the product over time. A rising ratio indicates increasing risk relative to the product's current value.
- Evolution of the weekly profits and losses (based on a buy and hold assumption) versus the respective previous-week VaR — used to backtest the confidence level of the VaR methodology. See the Technical Appendix for the VaR formulas used.
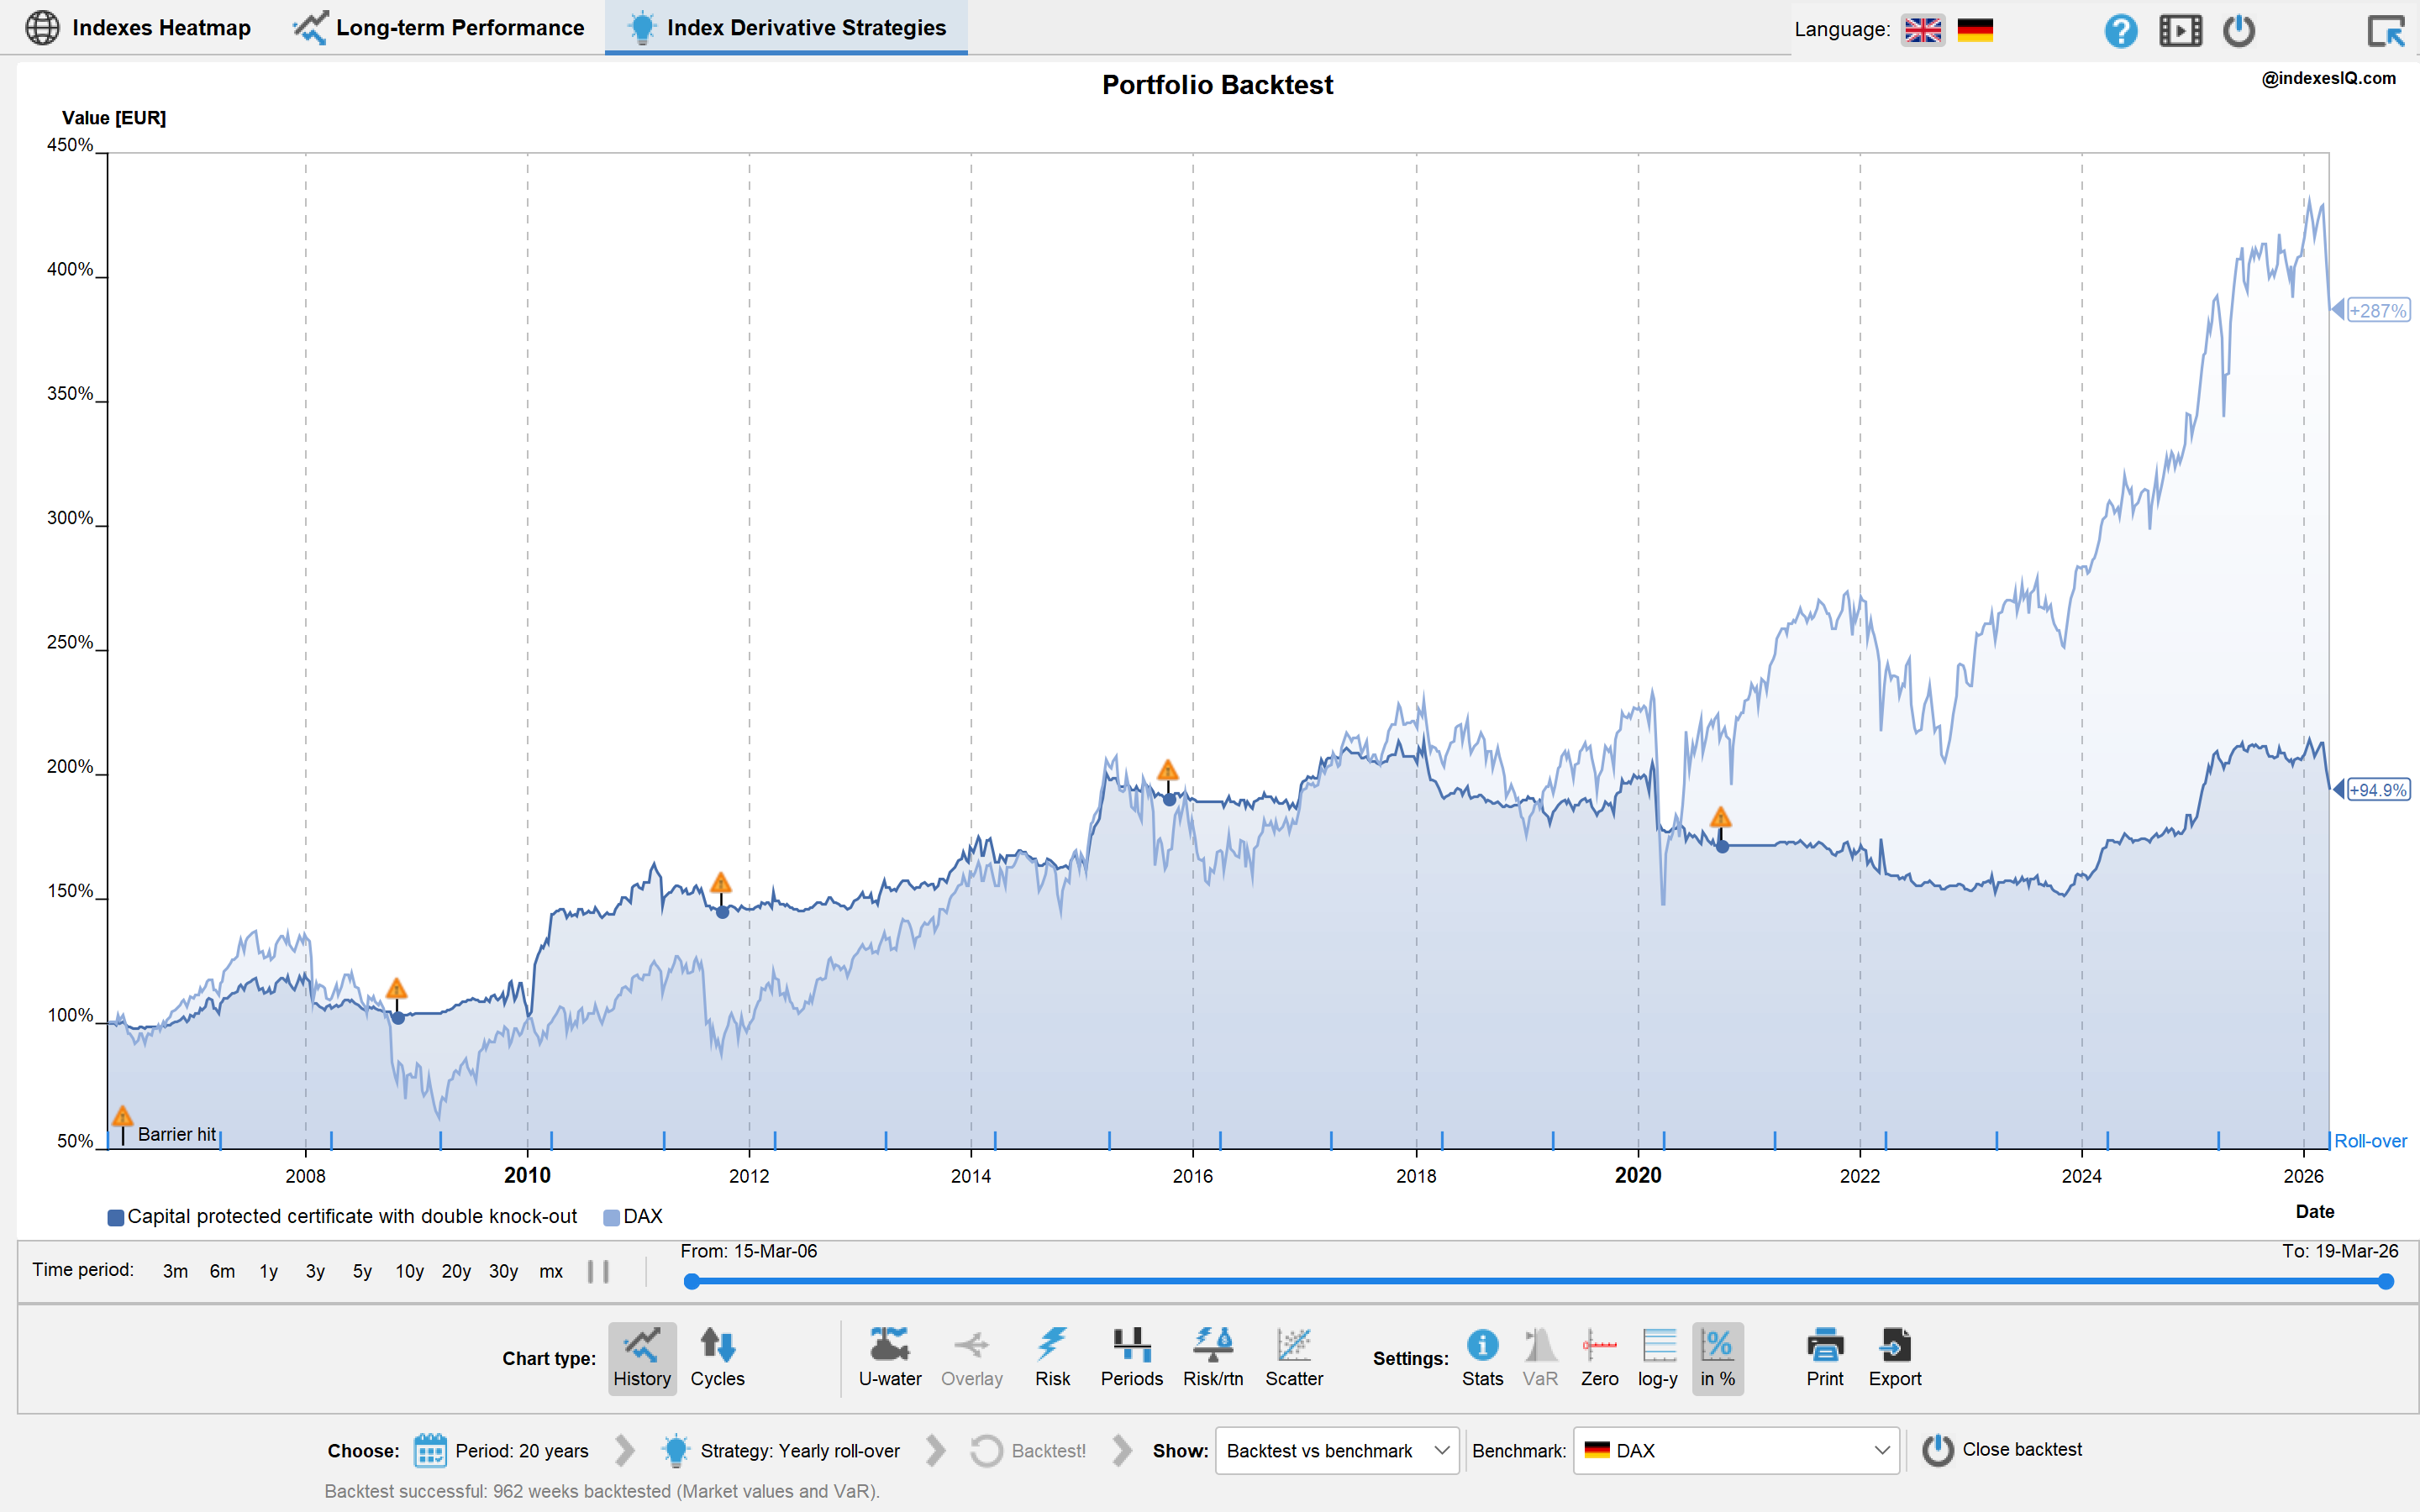
Backtest of a structured product with yearly roll-over compared to the underlying benchmark index. Barrier hits are indicated in the plot with warning signs. Blue lines on the x-axis indicate roll-over dates.
The Plot menu bar contains the following chart display functions:

Plot time series of the backtest.

Plot time series with peak-to-trough return analysis of bull and bear markets (defined as periods with at least ±20% returns).

Plot underwater chart: Shows the draw-down since the last all-time peak over time. Useful for assessing the worst periods for the strategy.

Plot distribution of percentage returns.

Plot histogram of period returns: Weekly, monthly, quarterly, semi-annual, yearly or bi-yearly returns, depending on the length of the time period.

Plot risk-return diagram showing the average yearly volatility and yearly return.

Scatter plot of historical returns of the product versus the underlying asset — visualises the product's payoff relationship to the index across real historical data points.
The Settings menu bar contains the following functions:

Information: Shows a table containing statistical information of the plotted data sets — including average return, volatility, Sharpe ratio and maximum drawdown.

Show x-axis: Set the scale of the y-axis to contain the value y = 0.

Y-log: Set the y-axis to log scale. Particularly useful for long backtests spanning decades, where log scale reveals percentage changes more clearly than linear scale.

Percent: Set the y-axis to percentages and re-base all time series to start with 100%. Allows direct comparison of strategies starting from a common base value.
For educational purposes only. Not investment advice.