
"I feel sorry for people who don't drink. When they wake up in the morning, that's as good as they're going to feel all day."
Jack Lemmon
American actor, The Apartment, Some Like It Hot
How Derivatives Change During Their Lifetime
Intrinsic value, time value, probability distributions and the risk matrix — how a structured product evolves from issuance to maturity.
The experience of drinking cocktails changes considerably during the time your body digests them: it typically starts with a sophisticated and pleasant flavour, continues with the euphoric stage of intoxication when the alcohol kicks in, and sometimes ends with a hangover the day after. In drinking, time works against you.
Likewise, a structured product's risk and performance profile can change considerably during its lifetime. However, unlike cocktails, for structured products time does not always work against you — for some products, it works in your favour. To understand when and why, we need to learn two fundamental concepts: intrinsic value and time value.
The payoff of a structured product at maturity is called its intrinsic value. The difference between its market value before maturity and its intrinsic value is the time value:
The time value is a key concept for options and structured products. It has two distinct components:
Time value · The time value denotes the difference between a product's present market value and its intrinsic value. It consists of two components:
- The opportunity time value, which is positive for convex payoffs, negative for concave payoffs, and zero for linear payoffs.
- The financing time value, which (assuming positive interest rates) is positive for products earning interest and negative for products paying interest.
Both components are a direct consequence of the No Free Lunch Rule — every advantage must be paid for. The opportunity time value is positive for convex payoffs because time represents the opportunity to outperform the underlying asset. It is negative for concave payoffs because time brings the risk of underperforming.
The financing time value may seem straightforward — if a product's replicating portfolio holds a bond, it accrues interest; if it borrows, it pays interest. But there is a subtlety. Practically any payoff at maturity involves a financing time value determined by the slope of the payoff: a positive payoff slope allows the investor to buy exposure in the underlying at maturity in the future, meaning the cash can still earn interest before maturity — a positive financing time value. A negative payoff slope effectively sells the underlying at maturity, forgoing interest until then — a negative financing time value (assuming positive rates). This is why central bank interest rate decisions directly affect the pricing of structured products.
A put option has a positive opportunity time value due to its convexity, but a negative financing time value when interest rates are positive (because of its negative payoff slope). When rates are positive, these two components partially offset each other — and for a deep in-the-money put, the overall time value can turn negative, meaning time actually works in the holder's favour. When interest rates are zero, there is no financing component and the time value is always positive due to convexity alone.
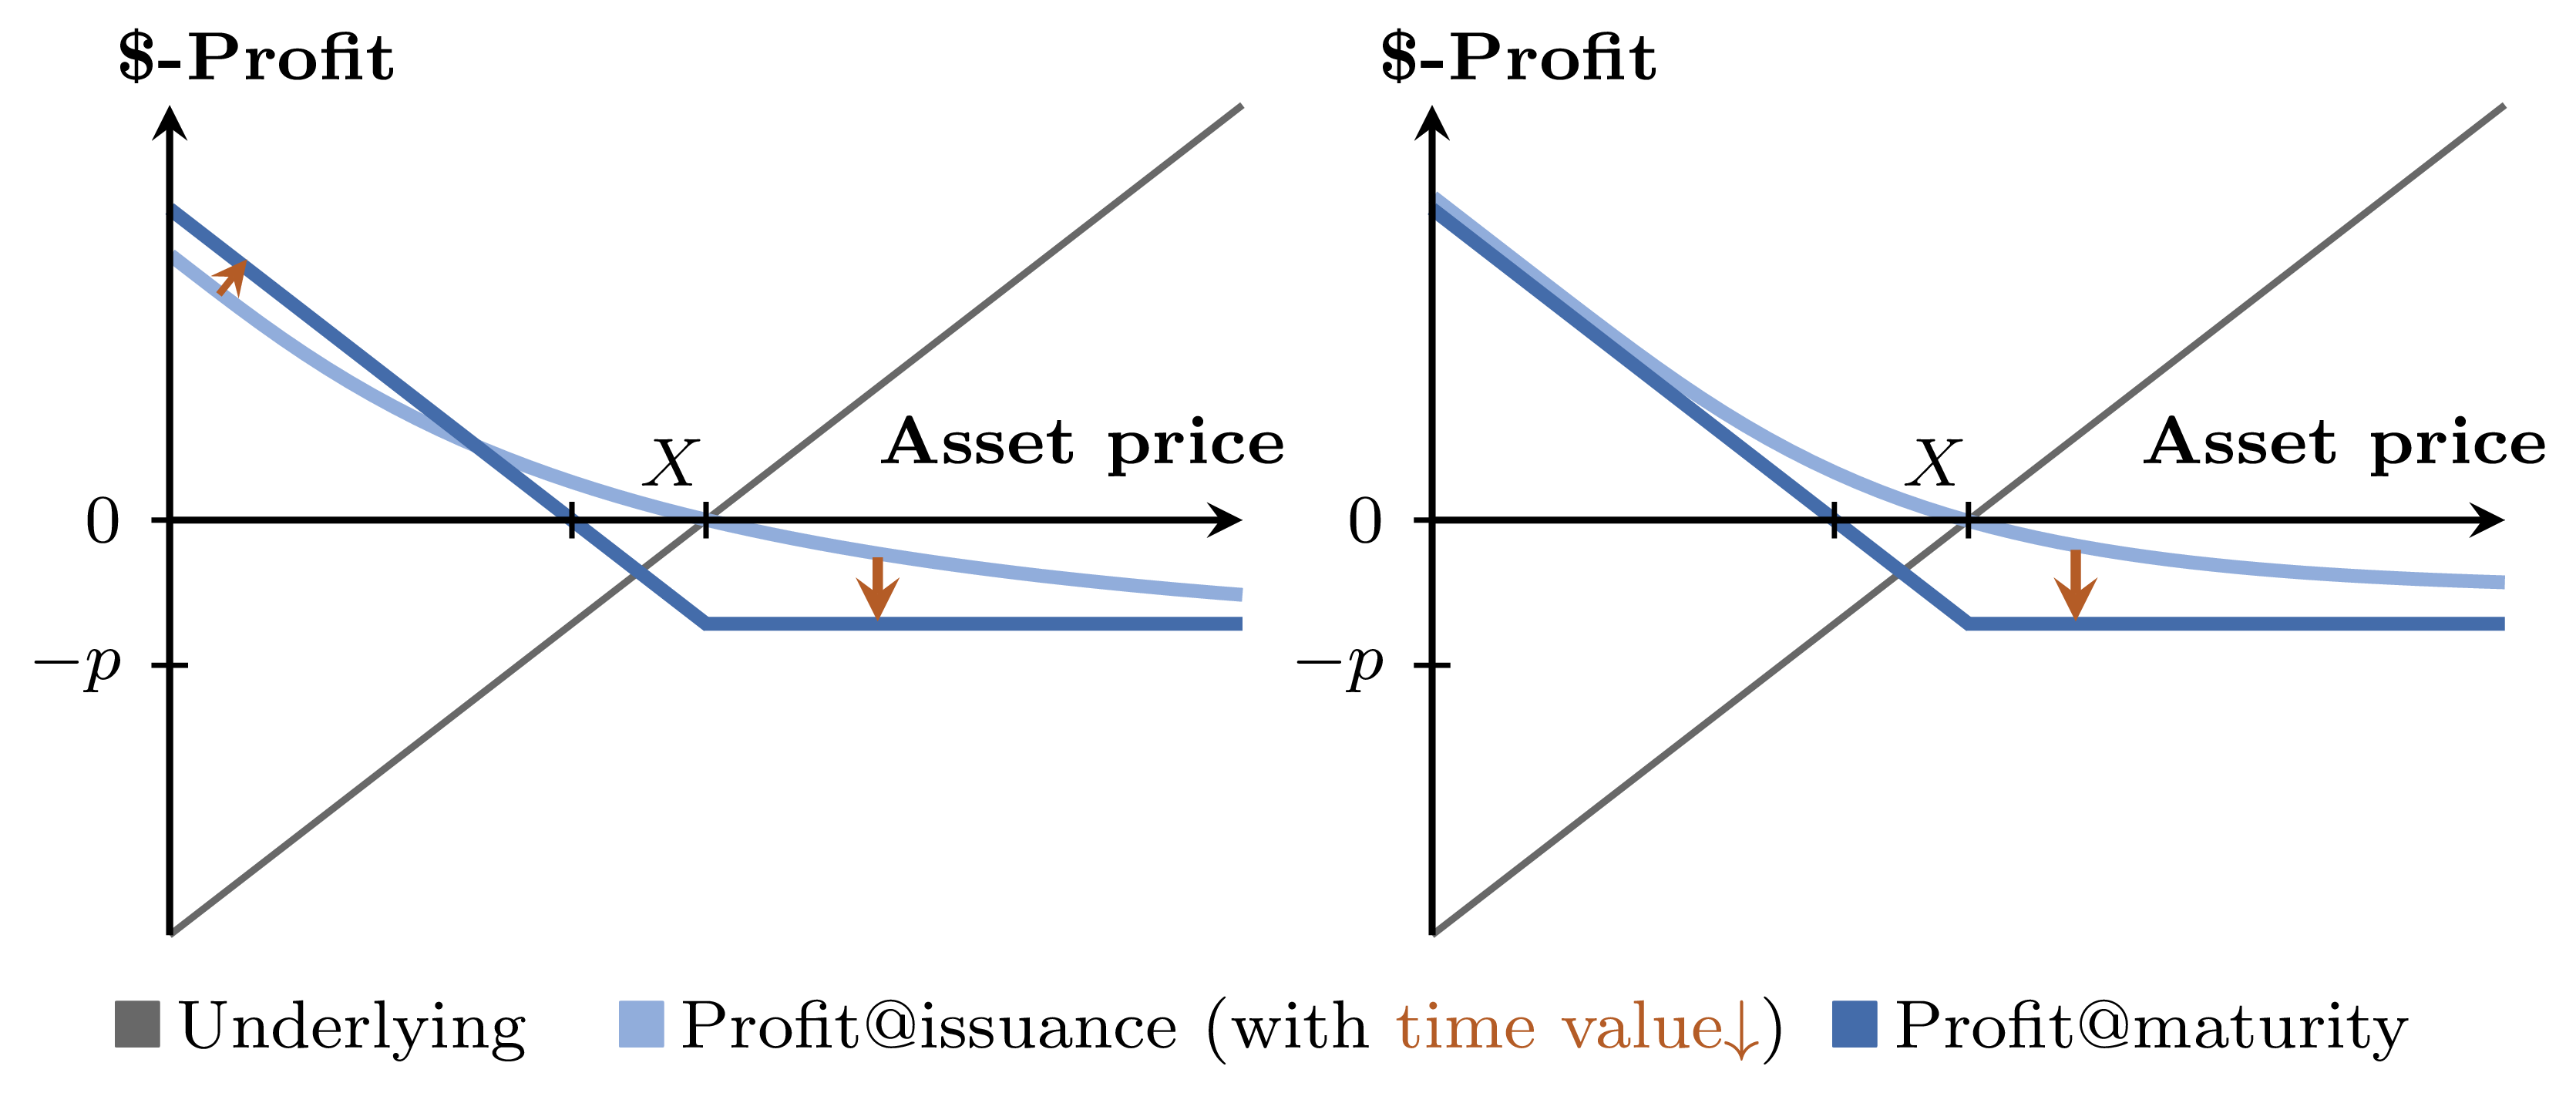
Profit at issuance and maturity of a put option with strike X, with positive interest rates (left) and zero interest rates (right). With positive rates, the deep in-the-money put has a negative overall time value — time works in the investor's favour. With zero rates, the time value is always positive.
The time value of options means that the probability distribution of profits changes during a product's lifetime. Figure 2 illustrates this for a call option, showing both the profit chart and the probability distribution at issuance and at maturity.
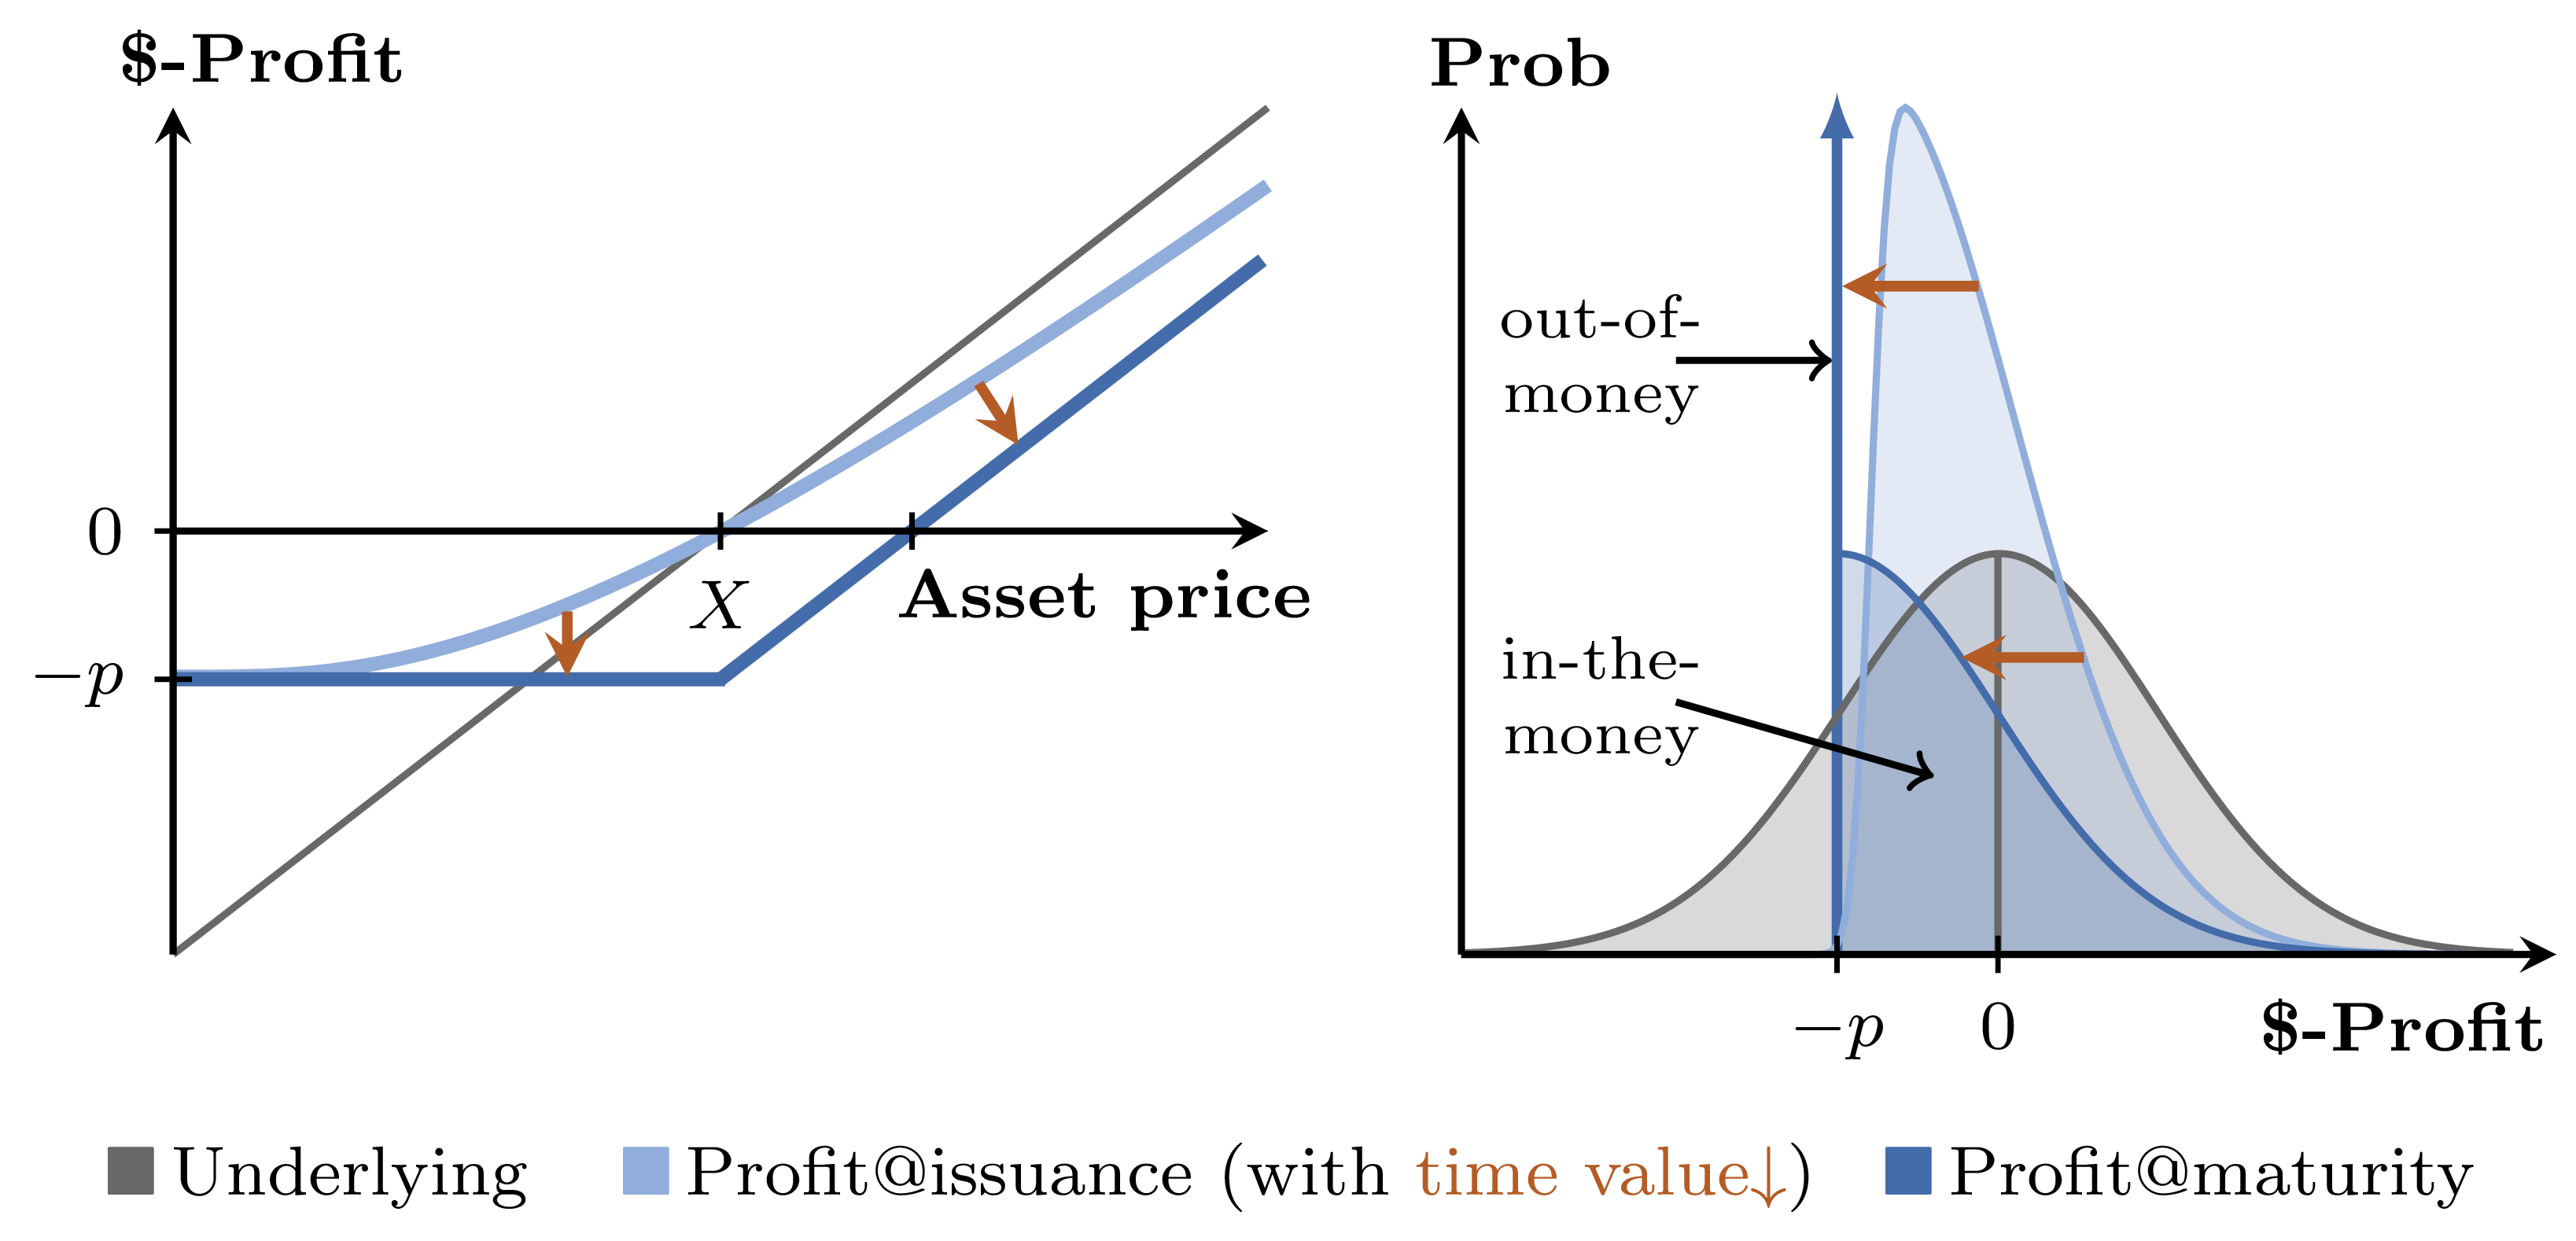
Profit (left) and probability distribution (right) of a call option with strike X. At issuance the distribution is continuous and upward-skewed. At maturity, a discrete probability spike appears representing the probability that the option expires worthless (out of the money).
At issuance, the probability distribution for a call option is continuous and upward-skewed due to the convexity of the payoff. At maturity, something important happens on the downside: there is a single discrete probability representing the chance that the option expires worthless. If the underlying asset has a symmetrical distribution around the strike, this spike represents approximately a 50% probability of expiring out of the money — though in practice the ratio depends on the specific strike and the distribution of the underlying asset.
This phenomenon is characteristic of options and structured products: their profit distribution typically has both continuous parts (where the payoff produces a range of outcomes) and discrete parts (spikes, where many scenarios collapse to a single outcome). Throughout this Academy, discrete parts of the probability distribution are indicated by spikes. They typically appear where the payoff at maturity hits a floor, a cap or a barrier.
Since the probability distribution changes so much during a product's lifetime, we plot it at two key points in time:
Prob@issuance · The probability distribution calculated using a holding period ending at the issuance date. It contains the full time value of all options but no interest accruals for fixed-income components.
Prob@maturity · The probability distribution using a holding period ending at maturity, when all derivatives have no remaining time value and all fixed-income instruments have reached their redemption level. Barrier hit probabilities are still included.
The participation and leverage of a product (introduced in Chapter 1) also change during its lifetime as the time value evolves. Figure 3 shows this for a call option — both the values at maturity and at issuance, where the time value of the option is incorporated.
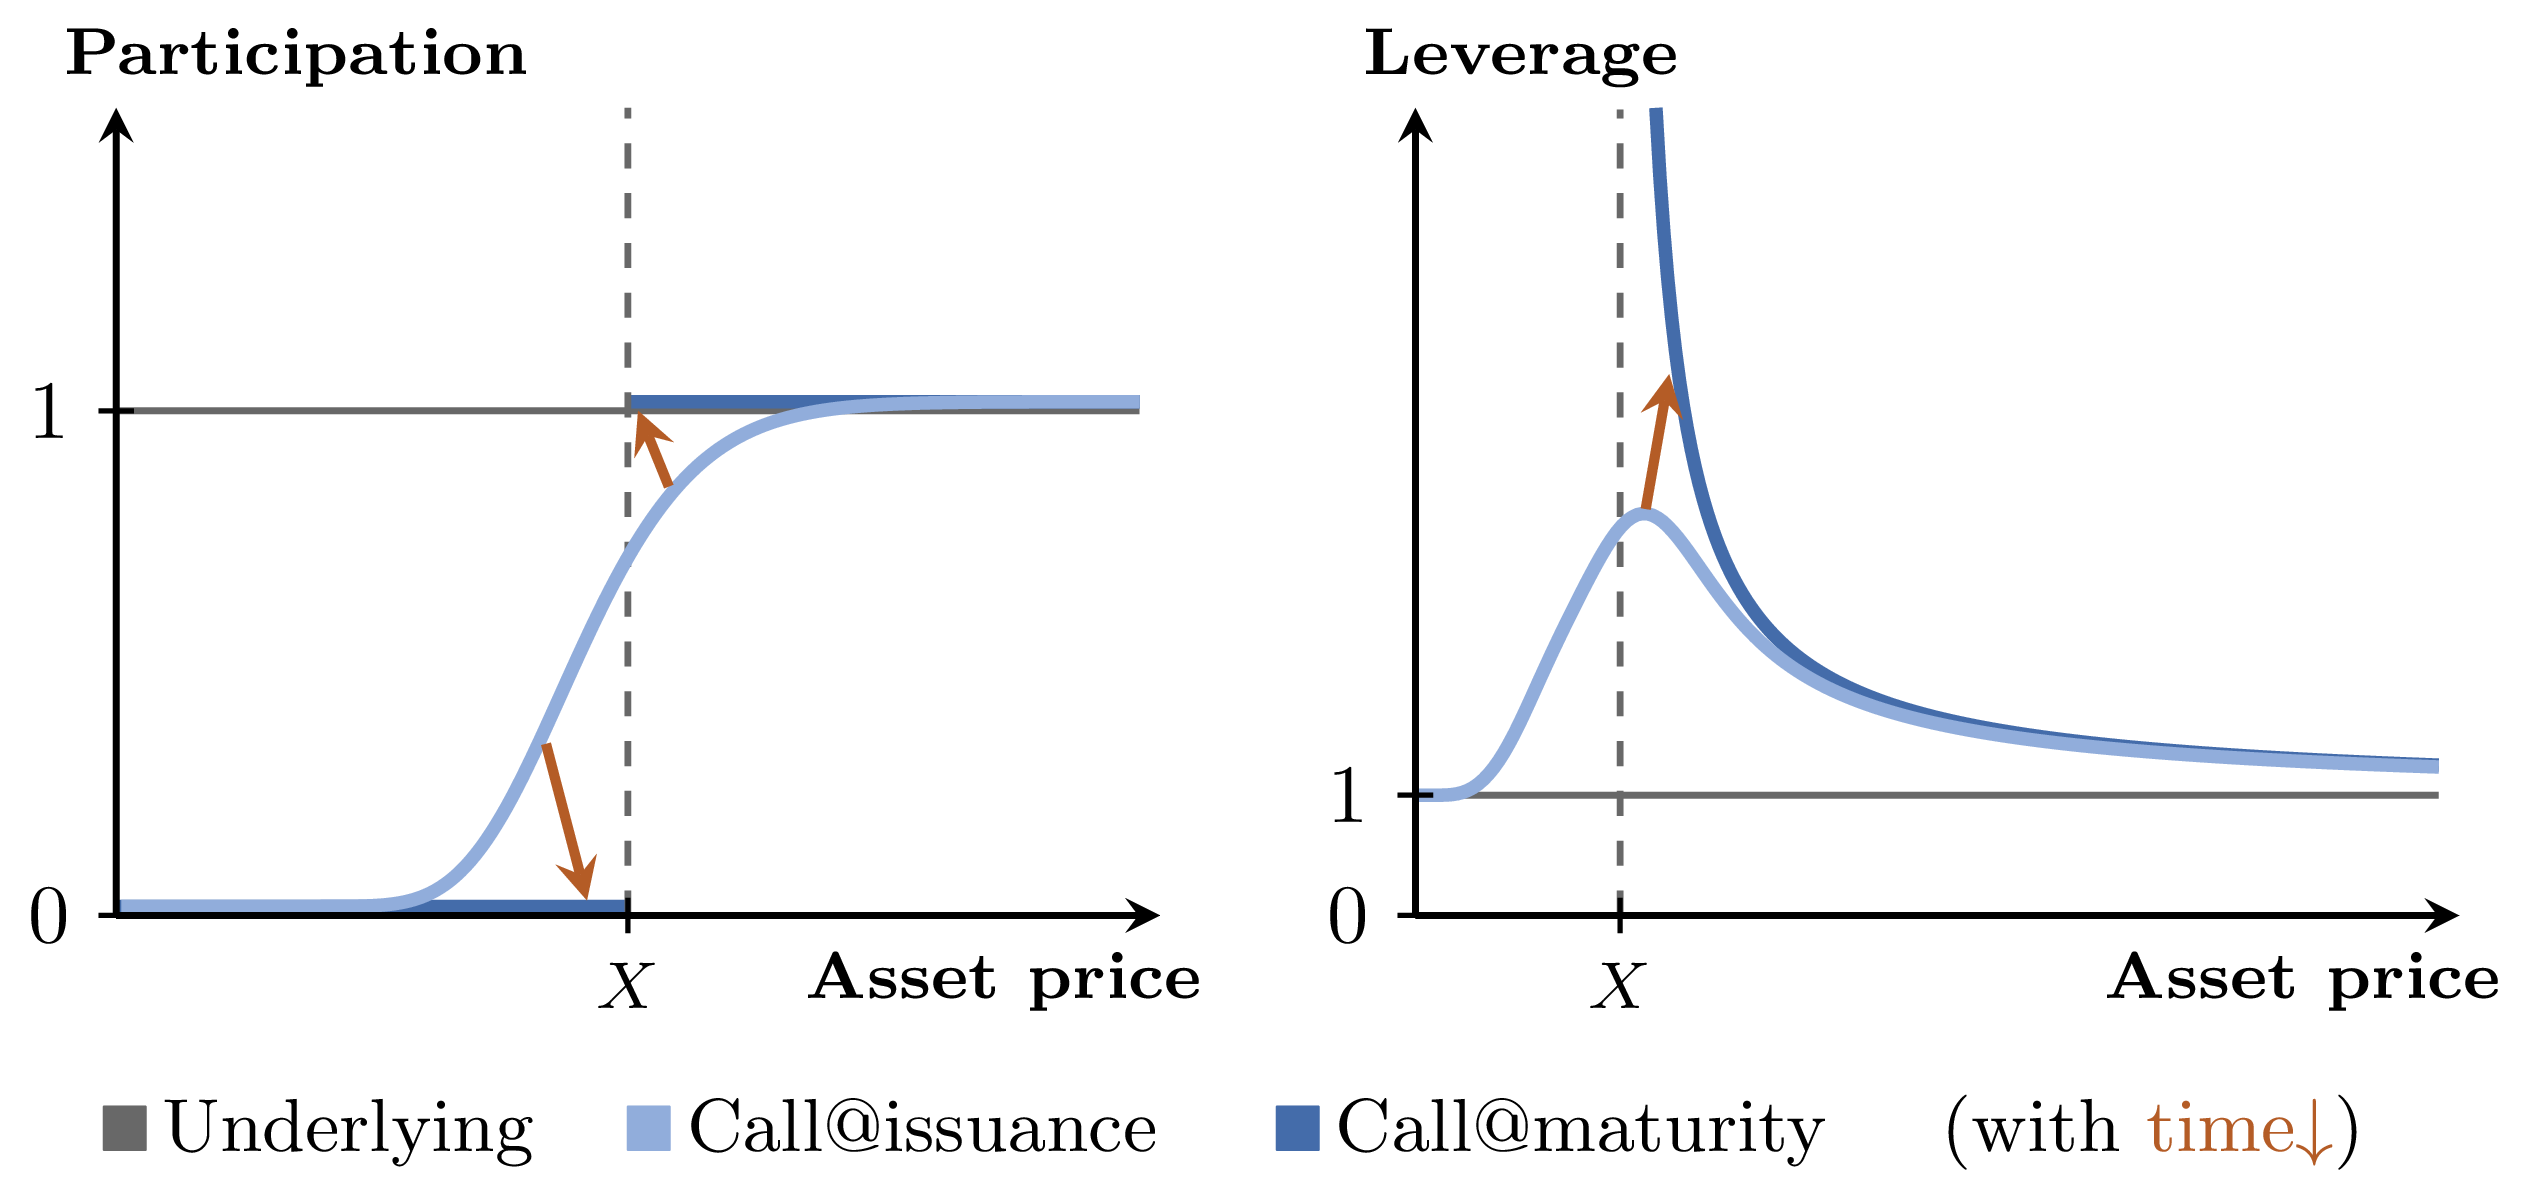
Participation (left) and leverage (right) of a call option with strike X, shown at issuance and at maturity. When the underlying price is far above the strike (deep in the money), both participation and leverage approach those of the underlying asset itself. When far below the strike (far out of the money), the call's value and participation approach zero.
To understand a structured product fully, we need to understand under what market conditions it performs well and when it does not. This is captured in the risk matrix — a summary of how the product behaves across different scenarios for the key risk factors that influence its price:
- Asset price — going up (Asset↑), sideways (Asset≈) or down (Asset↓)
- Interest rates — rising (Rates↑) or falling (Rates↓)
- Volatility — rising (Vol↑) or falling (Vol↓)
As an example, the risk matrix for an at-the-money call option shows how these factors affect the product both during its lifetime and at maturity:
| Return | During lifetime | At maturity |
|---|---|---|
| Outperformance | Rates↑, Vol↑ | Asset↑ |
| Lost premium | Asset≈, Asset↓ | |
| Loss | Rates↓, Vol↓ | Asset↓ |
Risk matrix for an at-the-money call option. During its lifetime, the call profits from rising interest rates (positive financing time value) and rising volatility (higher opportunity time value). At maturity, only the asset price matters — the option either finishes in the money (outperformance) or expires worthless (lost premium).
- The intrinsic value is the product's payoff at maturity
- The time value is the difference between market value before maturity and intrinsic value
- Time value = opportunity time value + financing time value
- Opportunity time value is positive for convex payoffs, negative for concave payoffs
- Financing time value is positive for positive payoff slopes, negative for negative slopes
- A positive time value means time works against the investor; a negative time value means time works in their favour
- The probability distribution of profits changes during a product's lifetime due to the time value
- At maturity, discrete probability spikes appear at floors, caps and barrier levels
- Distributions are plotted at two key moments: Prob@issuance and Prob@maturity
- The risk matrix summarises performance across scenarios for asset price, interest rates and volatility — both during the lifetime and at maturity
For educational purposes only. Not investment advice. Derivative products carry significant risks and may not be suitable for all investors.